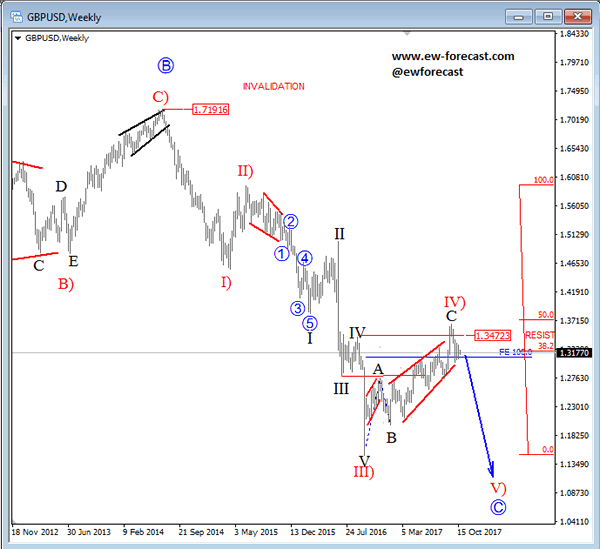
Good Monday traders! Hope you had a nice weekend, and a pleasant Sunday. Let’s take a look at GBPUSD and its long-term look.
On the weekly chart of GBPUSD we can see that price is looking overall bearish. We see a nice impulsive structure in the making, with price trading in one of its corrective waves. We are talking about wave IV), that can be ending its temporary rally. Sub-waves A-B and now C may have fully unfolded, which means a new drop lower may follow in weeks and months ahead. We can also see that some important Fibonacci ratios had been hit near the 38.2 and 50.0 region and even former swing high of lower degree wave IV, where all can offer resistance and a truning point. On that note, a minor fall in five-waves and a breach below the 1.23000 region would indicate final red wave V) to be in progress.

