
 in the month of April 2023.)
- Bullish acceleration within long-term secular uptrend to print a fresh all-time high of 166.60 yesterday, 30 August.
- Current minor pull-back of 102 pips from 166.60 all-time high has almost reached a short-term oversold condition as indicated by the hourly RSI.
- Key short-term support rests at 165.10.
The cross-pair CHF/JPY has continued its impulsive up-move sequence in the month of August where it rallied by +291 pips as of 31 August 2023 at this time of the writing, capping off a relentless bullish acceleration seen in the past six months with an accumulated gain of +2,378 pips since January 2023 reinforced by a clear bullish breakout from the longer-term secular ascending channel resistance (upper boundary) in the month of April 2023.
It has already surpassed the prior major secular peak of 158.45 printed in October 1979 and hit a fresh all-time intraday high of 166.60 yesterday, 30 August.
Bullish acceleration of long-term secular uptrend phase
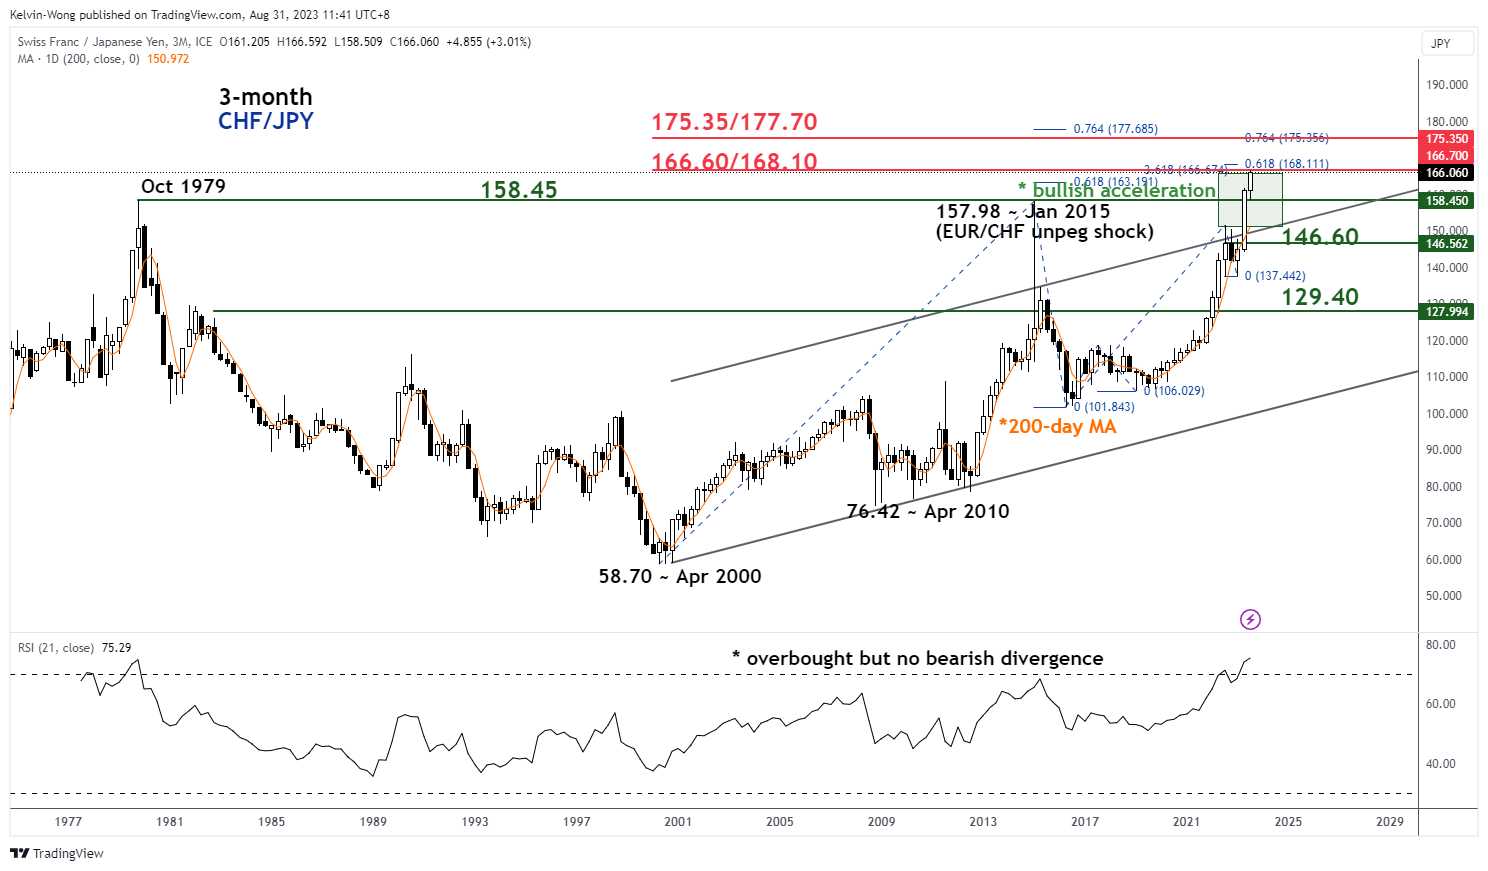
Fig 1: CHF/JPY long-term term secular trend as of 31 Aug 2023 (Source: TradingView, click to enlarge chart)
Hourly RSI oscillator has almost reached oversold condition

Fig 2: CHF/JPY minor short-term trend as of 31 Aug 2023 (Source: TradingView, click to enlarge chart)
On a shorter-term horizon, as inferred from the 1-hour chart, the CHF/JPY has just staged a minor pull-back of -102 pips to hit a current intraday low of 165.58 today, 31 August at this time of the writing. So far recent price actions have managed to trade above the 20-day moving average which indicates the short to medium-term uptrend phases remain intact.
In addition, the hourly RSI oscillator is now coming close to its oversold region which suggests a potential bullish reversal in price actions may take shape.
Watch the 165.10 key short-term pivotal support (also the 20-day moving average for another potential round of bullish impulsive sequence to retest 166.60 intermediate resistance and clearance above it sees the next resistances coming in at 167.10 and 168.10 next (Fibonacci extensions clusters).
On the flip side, failure to hold at the 165.10 support invalidates the bullish bias for an extension of the minor pull-back towards the next near-term support at 164.50 (the minor swing lows area of 19/25 August 2023), and below it exposes 163.80 support next (the lower boundary of the medium-term ascending channel from 20 March 2023 low).