
 has been the outperformer among the major US benchmark stock indices, thanks to its lesser concentration of technology stocks that bore the brunt of the sell-off inflicted on the US stock market.)
- Key technical elements are showing signs of bullish exhaustion below the 35,650 resistance.
- Potential downside mean reversion to test the 50-day moving average now acting as a support at 34,510.
In the past two weeks, the Dow Jones Industrial Average (DJIA) has been the outperformer among the major US benchmark stock indices, thanks to its lesser concentration of technology stocks that bore the brunt of the sell-off inflicted on the US stock market.
For the week of 31 July and 7 August, the DJIA recorded a weekly return of -1.11% and +0.62% respectively, in contrast, two consecutive weekly losses were seen in the S&P 500 (-2.27%, -0.31%), Nasdaq 100 (-3.02%, -1.62%), Russell 2000 (-1.21%, -1.65%) over the same period.
In the lens of technical analysis, the DJIA may start to evolve into a potential minor downtrend at this juncture as several key elements have started to exhibit bullish exhaustion.
Medium-term upside momentum has started to wane
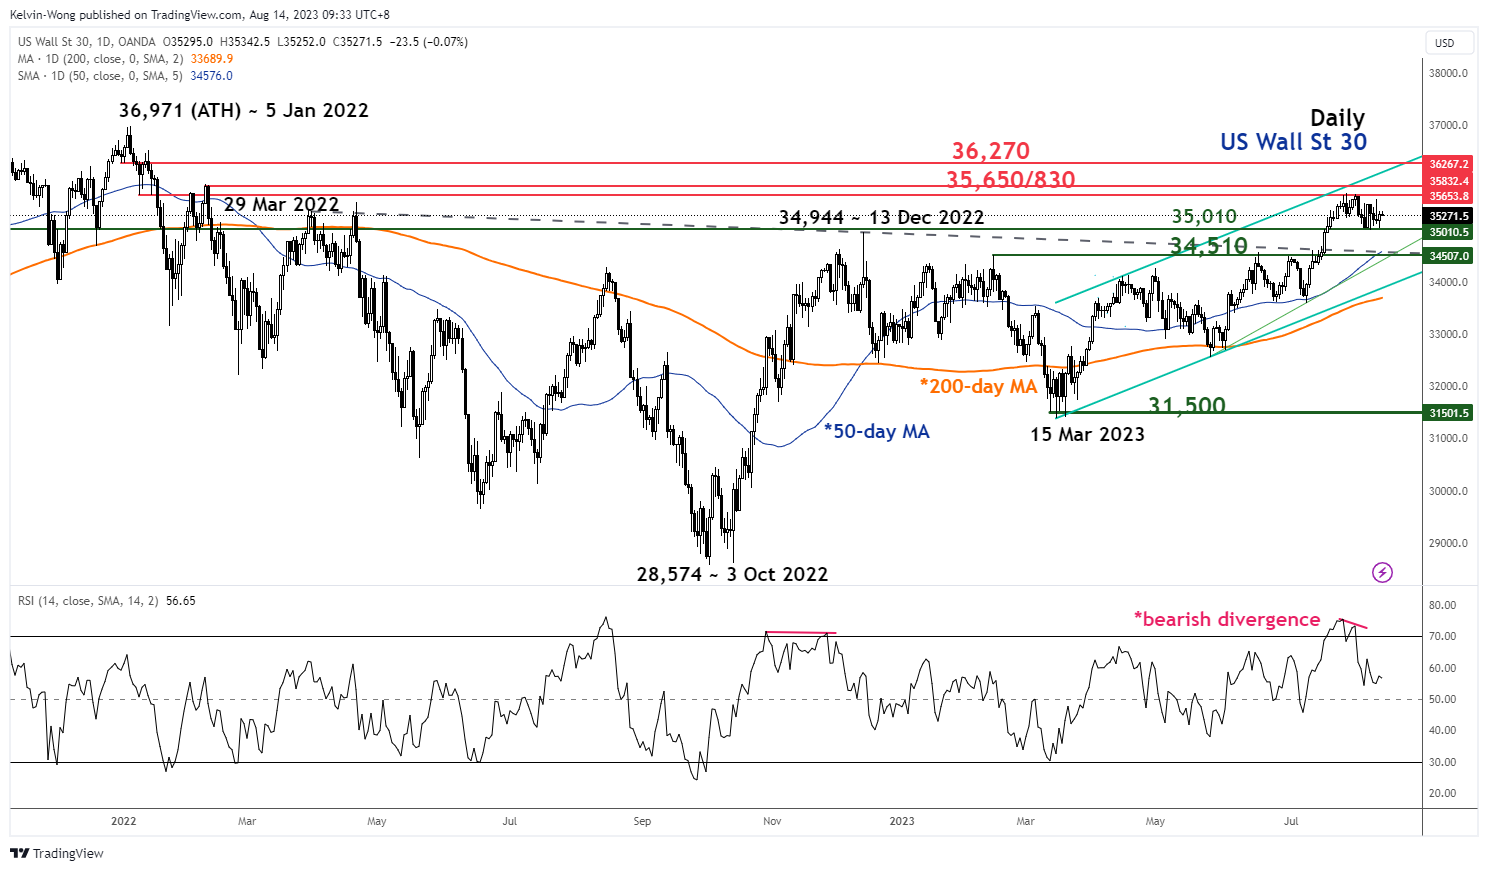
Fig 1: US Wall St 30 medium-term trend as of 14 Aug 2023 (Source: TradingView, click to enlarge chart)
In the past three weeks, the price actions of the US Wall St 30 Index (proxy of the Dow Jones Industrial Average futures) have failed to have a clear bullish breakout above the key swing high areas of 29 March/18 April 2023. These key swing-high areas have key psychological importance as they preceded the prior medium-term impulsive down move that recorded a loss of -19.20% on the Index to print an intraday low of 28,574 on 3 October 2022.
In conjunction, the daily RSI oscillator flashed a bearish divergence condition at its overbought region (above 70) on 1 August 2023, and a similar prior bearish divergence condition was seen on 25 November 2022 that led to a price decline of -10% on the Index from its 13 December 2022 high of 34,944 to 15 March 2023 low of 31,385.
Potential downside mean reversion to test 50-day moving average
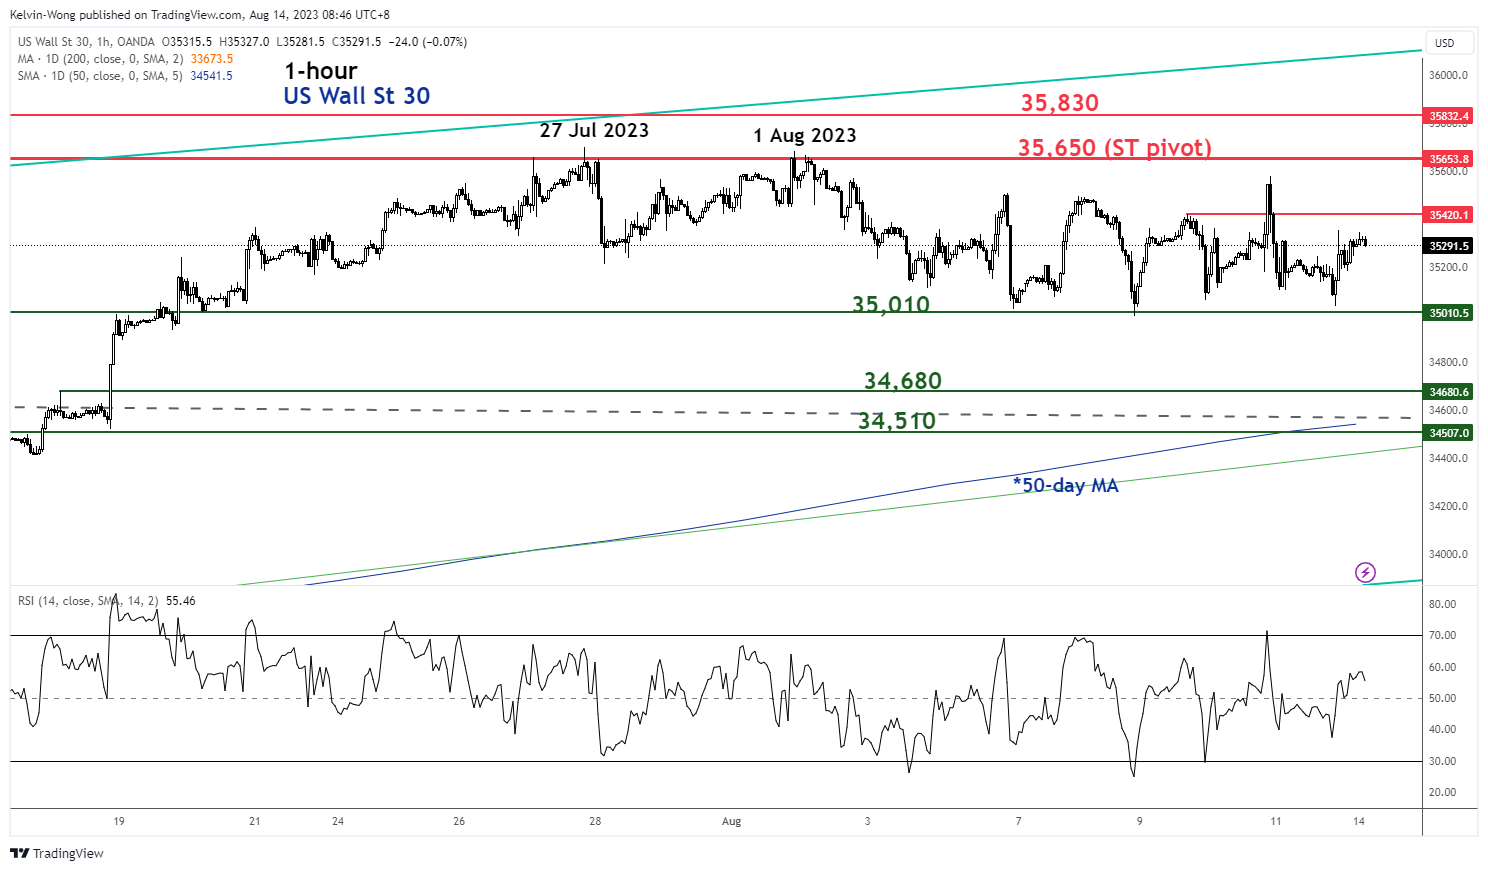
Fig 2: US Wall St 30 minor short-term trend as of 14 Aug 2023 (Source: TradingView, click to enlarge chart)
Watch the 35,650 key short-term pivotal resistance (also the recent swing highs of 27 July/1 August 2023) and a break below the near-term minor range support of 35,010 exposes the next supports at 34,680, and 34,510 (50-day moving average, trendline support from 25 May 2023 low & former range resistance from 29 March 2022 high).
However, a break above 35,650 invalidates the bearish tone to see the next 35,830 immediate resistance in the first step. A clearance above 35,830 sees the next resistance at 36,270.