NZD/USD is sitting nicely at a confluence of resistance, capped by both a horizontal level tested by previous swing highs and the trend line drawn by connecting each lower high that we can clearly see on the daily chart.
NZD/USD Daily:

It’s the three lower highs that are the most telling when it comes to displaying whether the bulls or bears are in control of the market. Each time that the bulls have bought the pair up, they haven’t been able to sustain and with each failure to make a new high, you can see that the buyers are diminishing in numbers. When the buyers have been totally exhausted, all that remains are the sellers and this is where you see the big drops occur.
You can also see how important this horizontal level was back in May/June of last year, with some very strong rejections off the level shown on the chart by huge wicks followed by bearish candles. Yes price has chopped through the level since, but that doesn’t make it any less significant, especially given the fact that it may be getting reactivated on that final rejection that we have marked on the chart above.
NZD/USD Hourly:

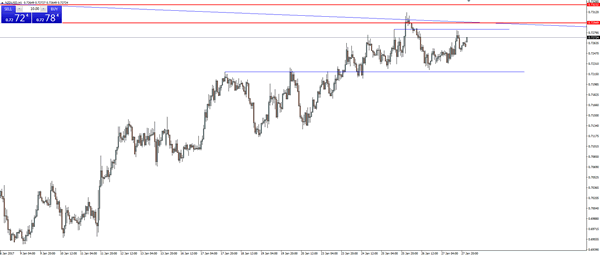
Zooming into the hourly chart on our MT4 platform to look for an entry, the problem is that there really isn’t an obvious area of short term support that would turn to resistance and allow us to get in. I’m never one to advocate blindly shorting a higher time frame level, especially in the midst of the bullish momentum that is shown clearly on this hourly chart, so it’s caution being shown by me.
The scenarios for here would be either short off a re-test of the lower blue level, or to wait for a 2nd test and hold of the daily zone and see if a new intraday entry level will form. For now we wait.
