Hello fellow traders. In this technical article we’re going to take a look at the Elliott Wave charts of CADJPY forex pair, presented in members area of the of our website. As our members know, CADJPY is showing impulsive bullish sequences in the cycle from the 94.069 low. Consequently , we recommended members to avoid selling the pair and keep favoring the long side.The pair is bullish against the 98.36 low. Recently we got nice 3 waves pull back that unfolded as Elliott Wave Double Three Pattern. The pair found buyers right at the equal legs and made rally as expected. In further text we are going to explain Elliott Wave Forecast and Double Three Pattern.
Before we take a look at the real market example, let’s explain Elliott Wave Double Three pattern.
Elliott Wave Double Three Pattern
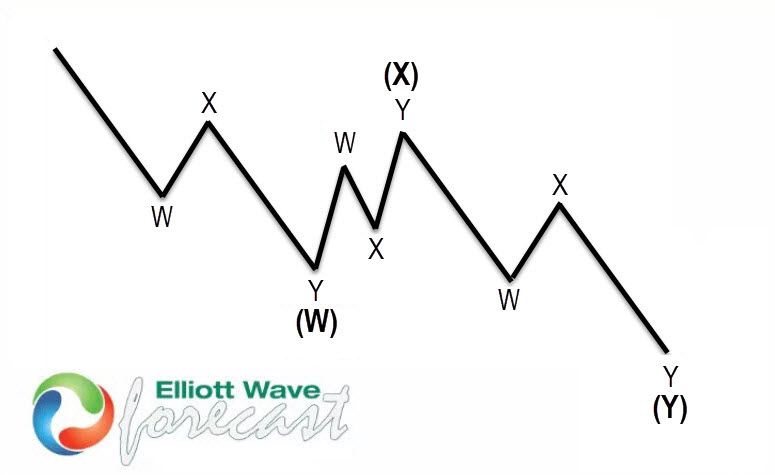
Double three is the common pattern in the market , also known as 7 swing structure. It’s a reliable pattern which is giving us good trading entries with clearly defined invalidation levels.
The picture below presents what Elliott Wave Double Three pattern looks like. It has (W),(X),(Y) labeling and 3,3,3 inner structure, which means all of these 3 legs are corrective sequences. Each (W) and (Y) are made of 3 swings , they’re having A,B,C structure in lower degree, or alternatively they can have W,X,Y labeling.
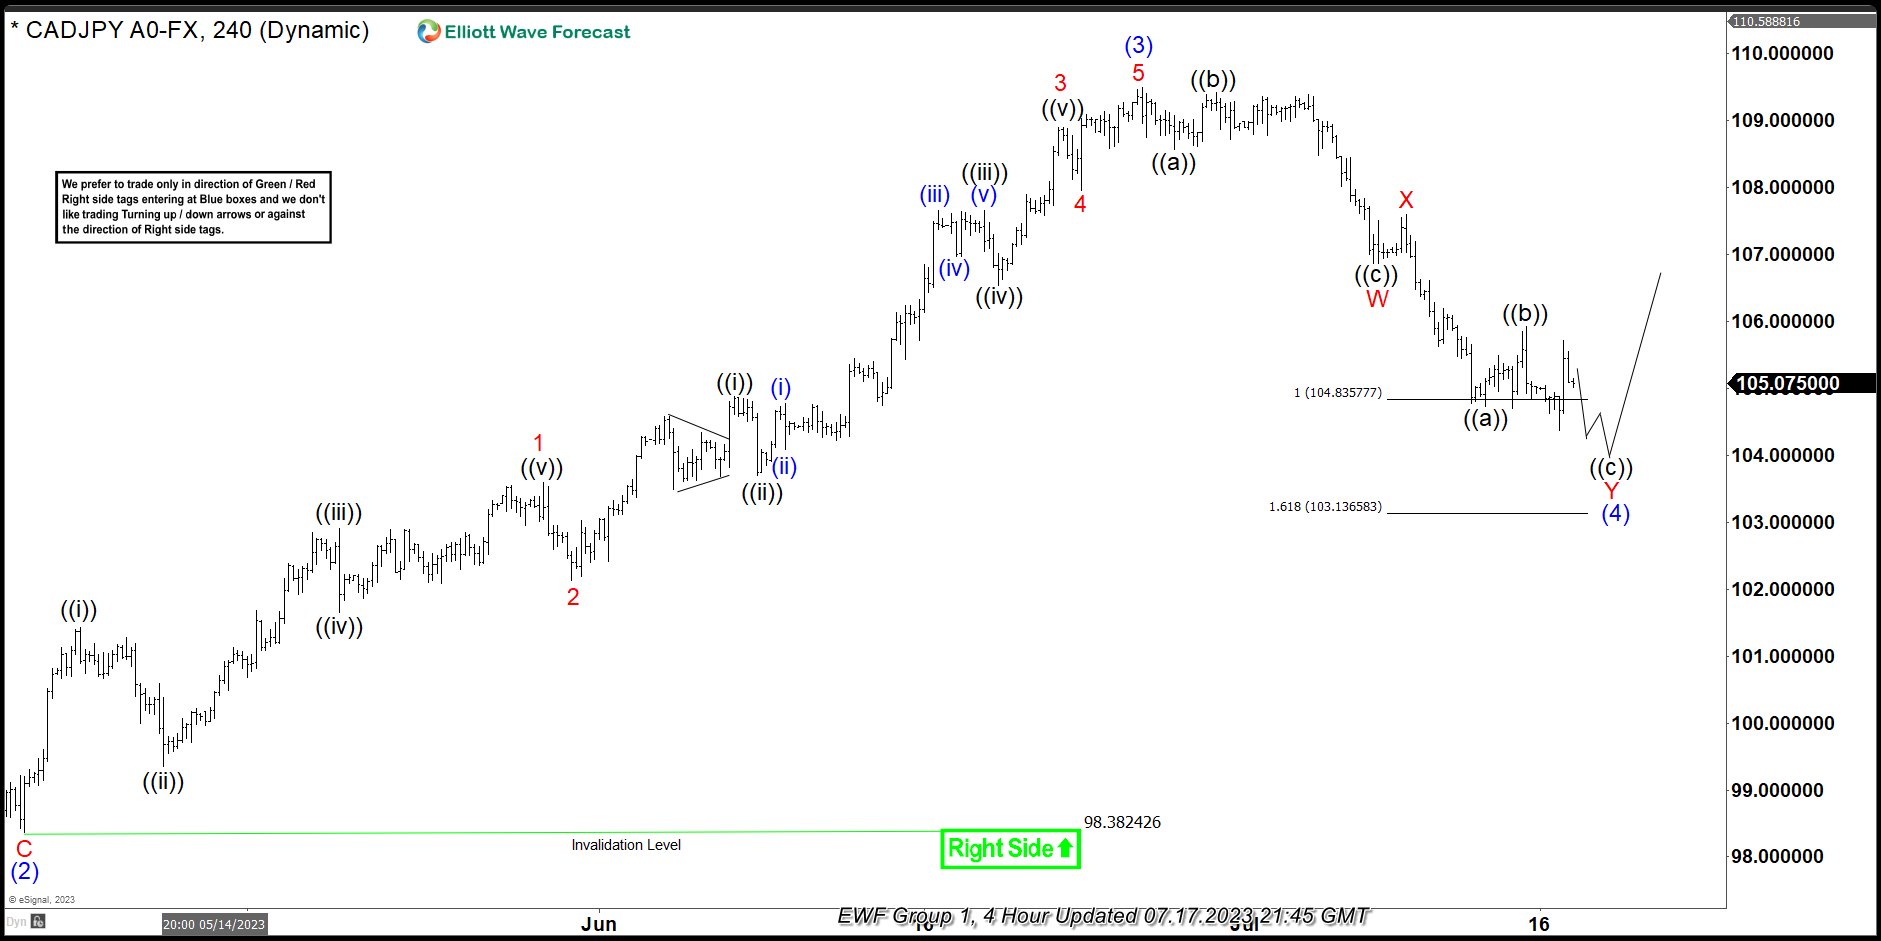
CADJPY Elliott Wave 4 Hour Chart 07.17.2021
The pair has made 5 waves up in the rally from the 98.38.71 low which is considered to be wave (3) of larger bullish cycle. Current view suggests the pair can be still doing (4) blue correction that is unfolding as Elliott Wave Double Three Pattern with WXY red inner labeling. First leg W is showing corrective sequences – 3 waves down ((a))((b))((c)). Then we got 3 waves bounce in X red in shallow correction. The price has already reached extreme zone at 104.835-103.136. However wave Y red still can see another wave down to complete the pattern. We expect buyers to appear soon.
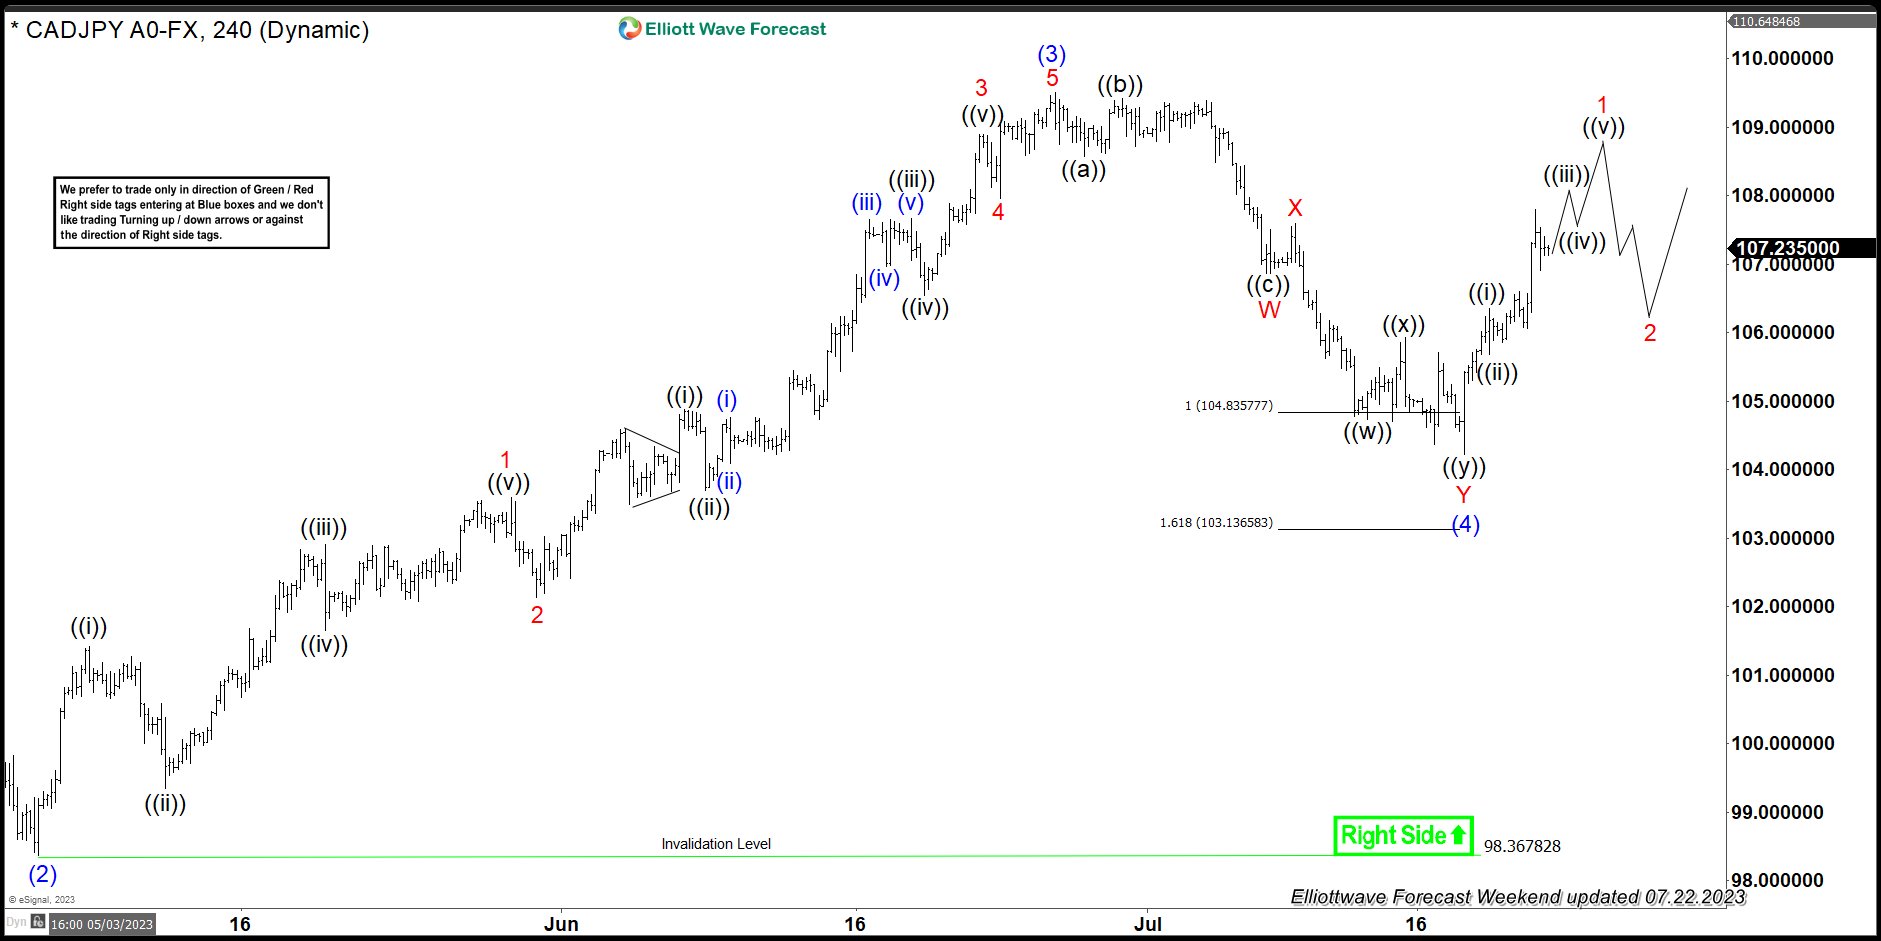
CADJPY Elliott Wave 4 Hour Chart 07.22.2021
Current view suggests the pair completed wave (4) blue pull back as a 7 swing pattern at the 104.24 low. The buyers appeared and we got nice reaction from the equal legs area. As far as the pivot at 104.24 low holds, the pair should ideally continue trading higher. Break of (3) blue is needed to confirm next leg up is in progress.