DXY:
The DXY chart currently demonstrates bearish momentum, indicating a downward trend in price.
There is a potential for a bearish continuation towards the first support level at 103.29. This support level represents an area of overlap support, suggesting its significance in potentially halting the downward movement.
Additionally, the second support level at 102.81 reinforces the potential for support. This level coincides with the 50% Fibonacci retracement, further highlighting its importance as a potential area of support.
On the upside, there is an intermediate resistance level at 103.75, representing a swing high resistance. This level may pose a hurdle to upward movement and could potentially act as a point of resistance.
Furthermore, the first resistance level at 104.40 is an area of overlap resistance. It could potentially impede bullish momentum and act as a barrier to further upward movement.
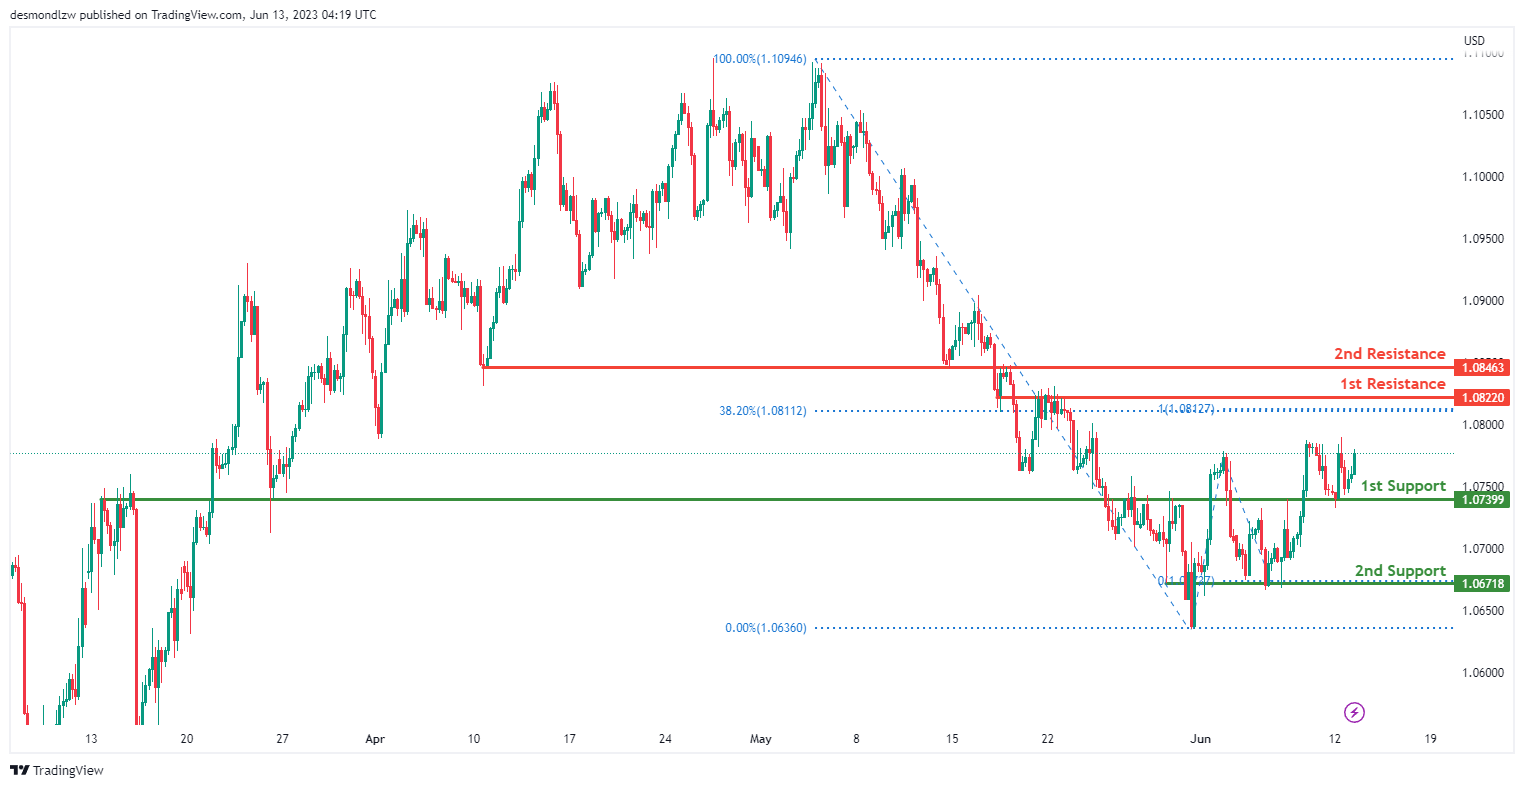
EUR/USD:
The EUR/USD chart currently exhibits a neutral momentum, indicating a lack of clear direction in price movement.
There is a possibility for price to fluctuate between the first resistance level at 1.0822 and the first support level at 1.0740. The first support level represents an area of overlap support, while the first resistance level acts as an area of overlap resistance. Additionally, the first resistance level is reinforced by the presence of a 38.20% Fibonacci retracement.
Furthermore, the second support level at 1.0672 and the second resistance level at 1.0846 also serve as areas of overlap support and resistance, respectively.
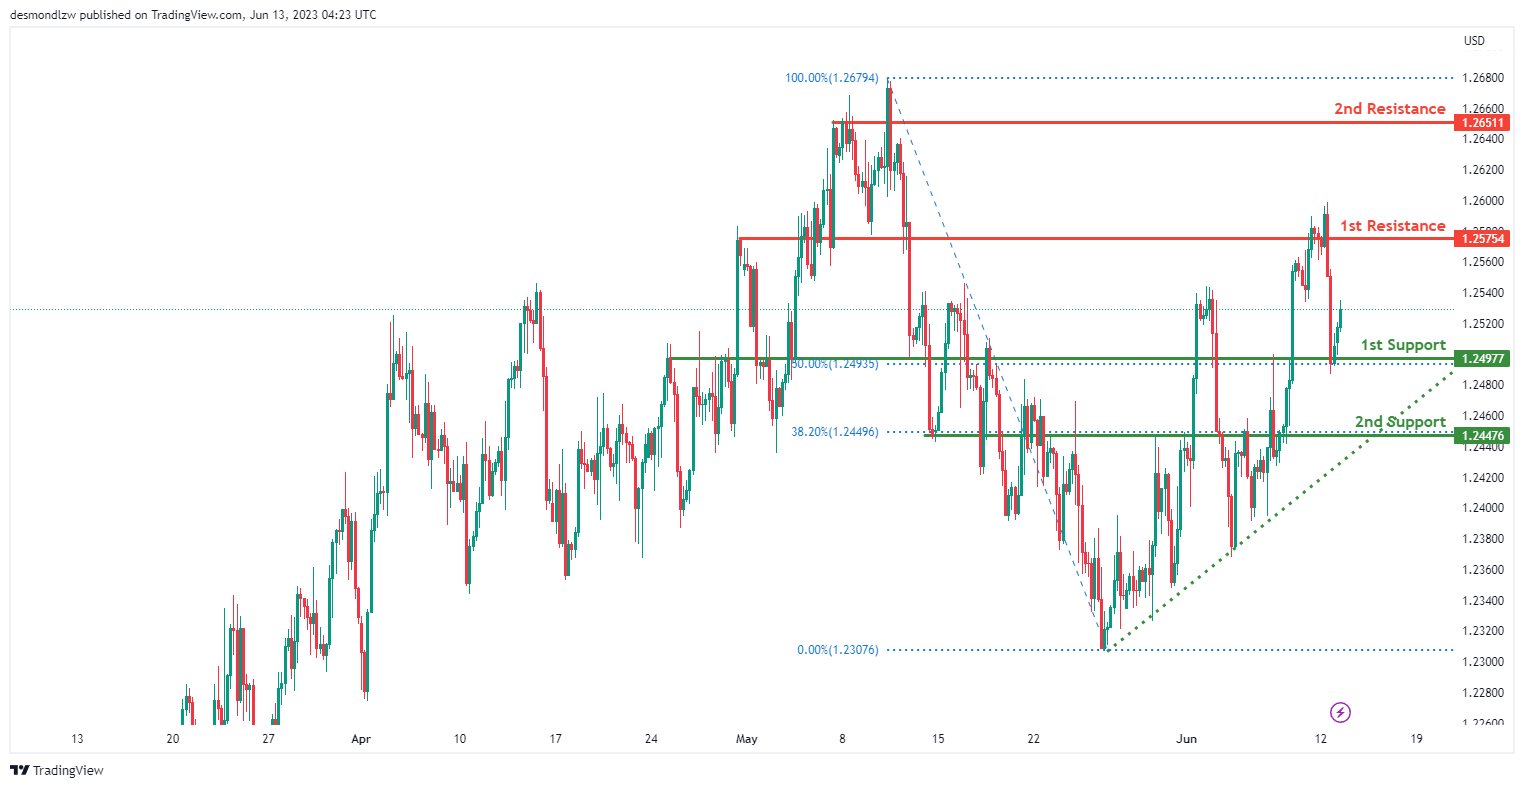
GBP/USD:
The GBP/USD chart currently exhibits a weak bullish momentum with low confidence, suggesting a tentative upward bias in price movement.
There is a potential for a bullish continuation towards the first resistance level at 1.2575. This resistance level is significant as it represents an area of overlap resistance.
On the downside, the first support level at 1.2498 is an important area to watch. It coincides with a 50% Fibonacci retracement level and provides potential support for the price. Additionally, the second support level at 1.2448 is another area of support, representing an overlap support level along with a 38.20% Fibonacci retracement.
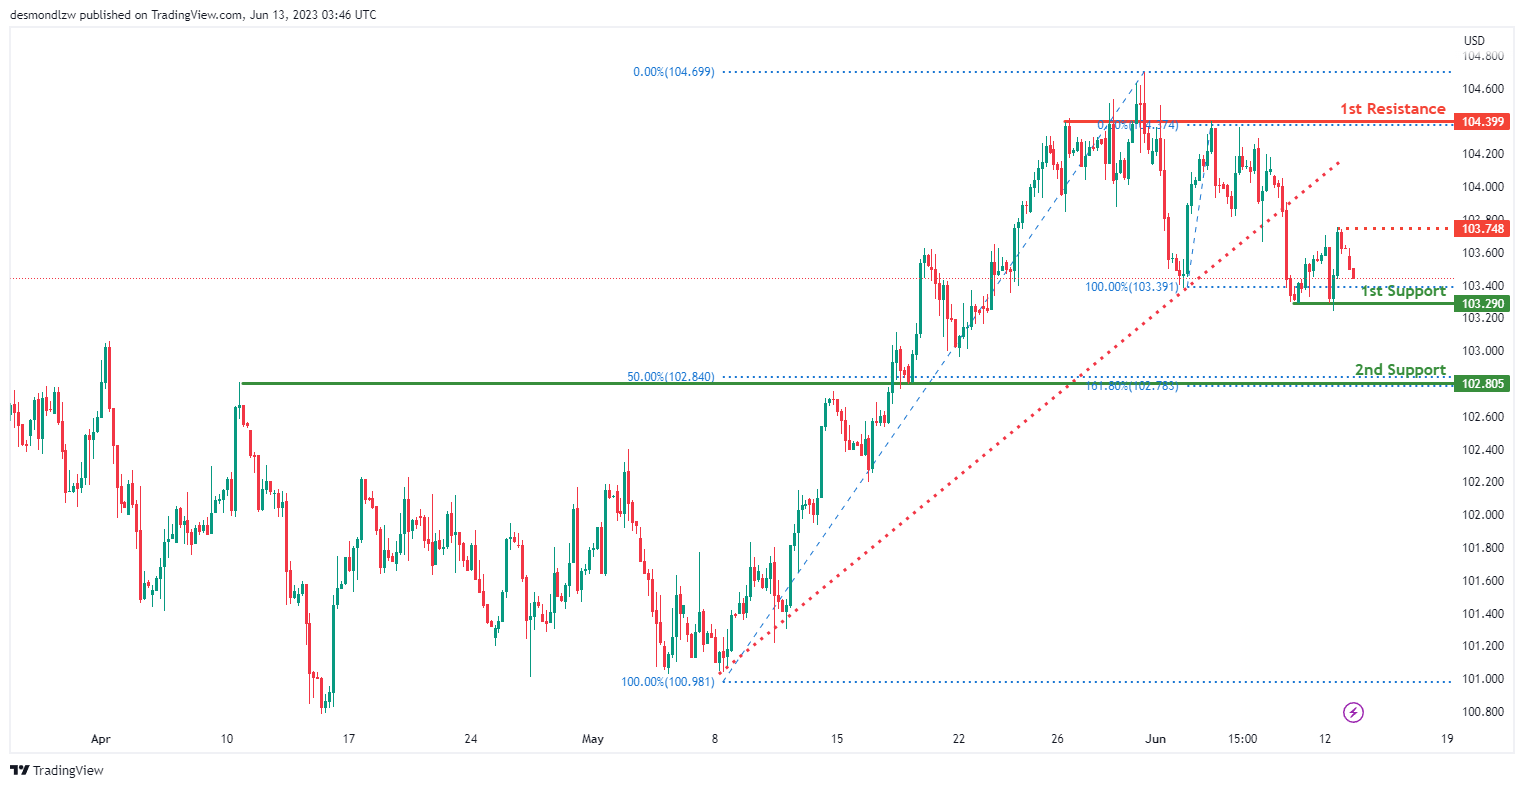
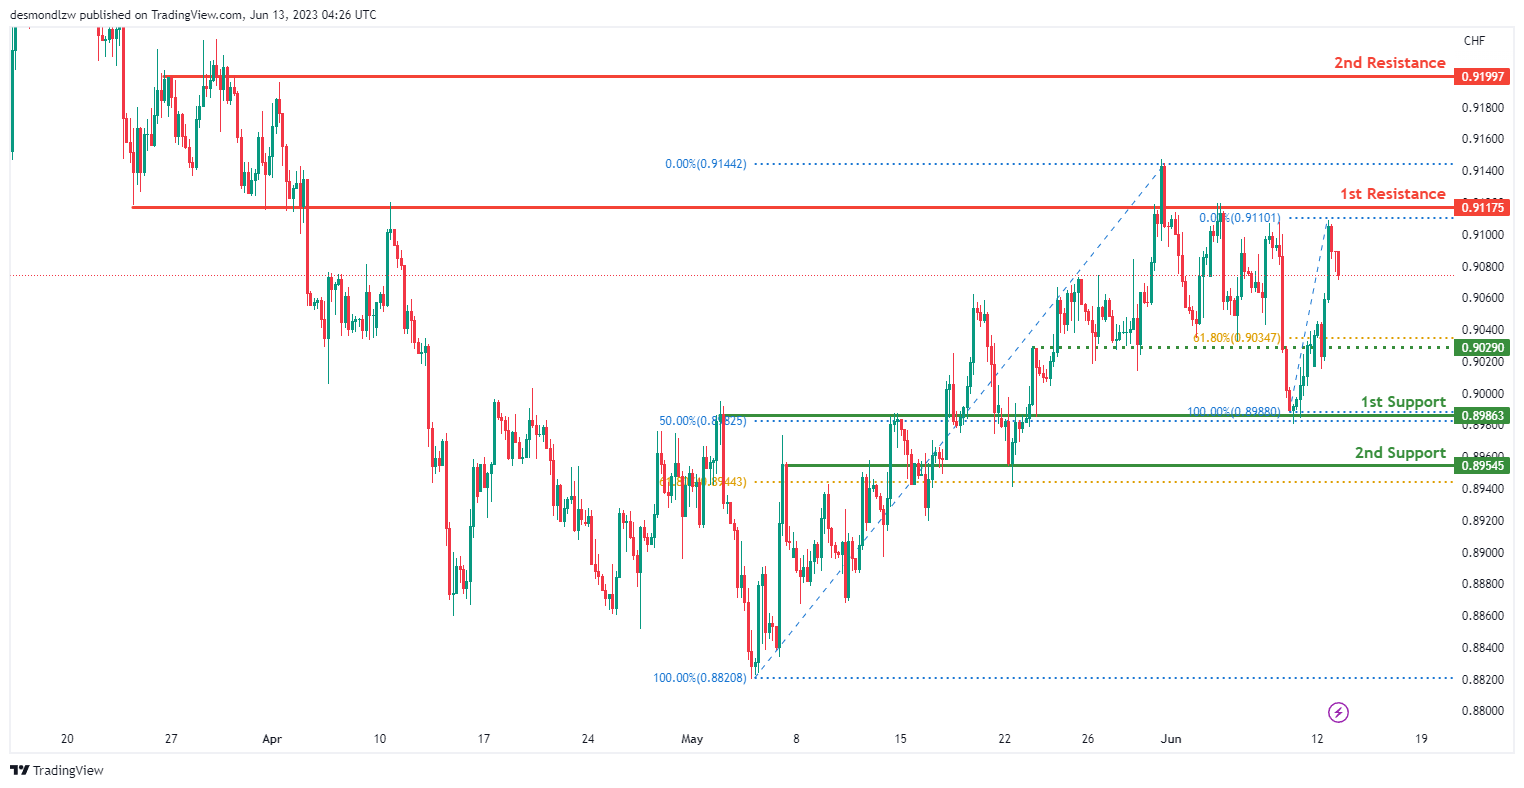
USD/CHF:
The USD/CHF chart currently shows a bearish momentum, indicating a downward bias in price movement.
There is a potential for a bearish continuation towards the first support level at 0.8986. This support level is significant as it represents an area of overlap support and coincides with a 50% Fibonacci retracement level. There is also an intermediate support level at 0.9029 that aligns with the 61.8% Fibonacci retracement level.
Additionally, the second support level at 0.8955 further strengthens the potential for downward movement. It is an area of overlap support and aligns with a 61.80% Fibonacci retracement level.
On the upside, the first resistance level at 0.9118 acts as a level of resistance, representing an area of overlap resistance.
Similarly, the second resistance level at 0.9200 is also an area of overlap resistance, further reinforcing the potential for price to face resistance.
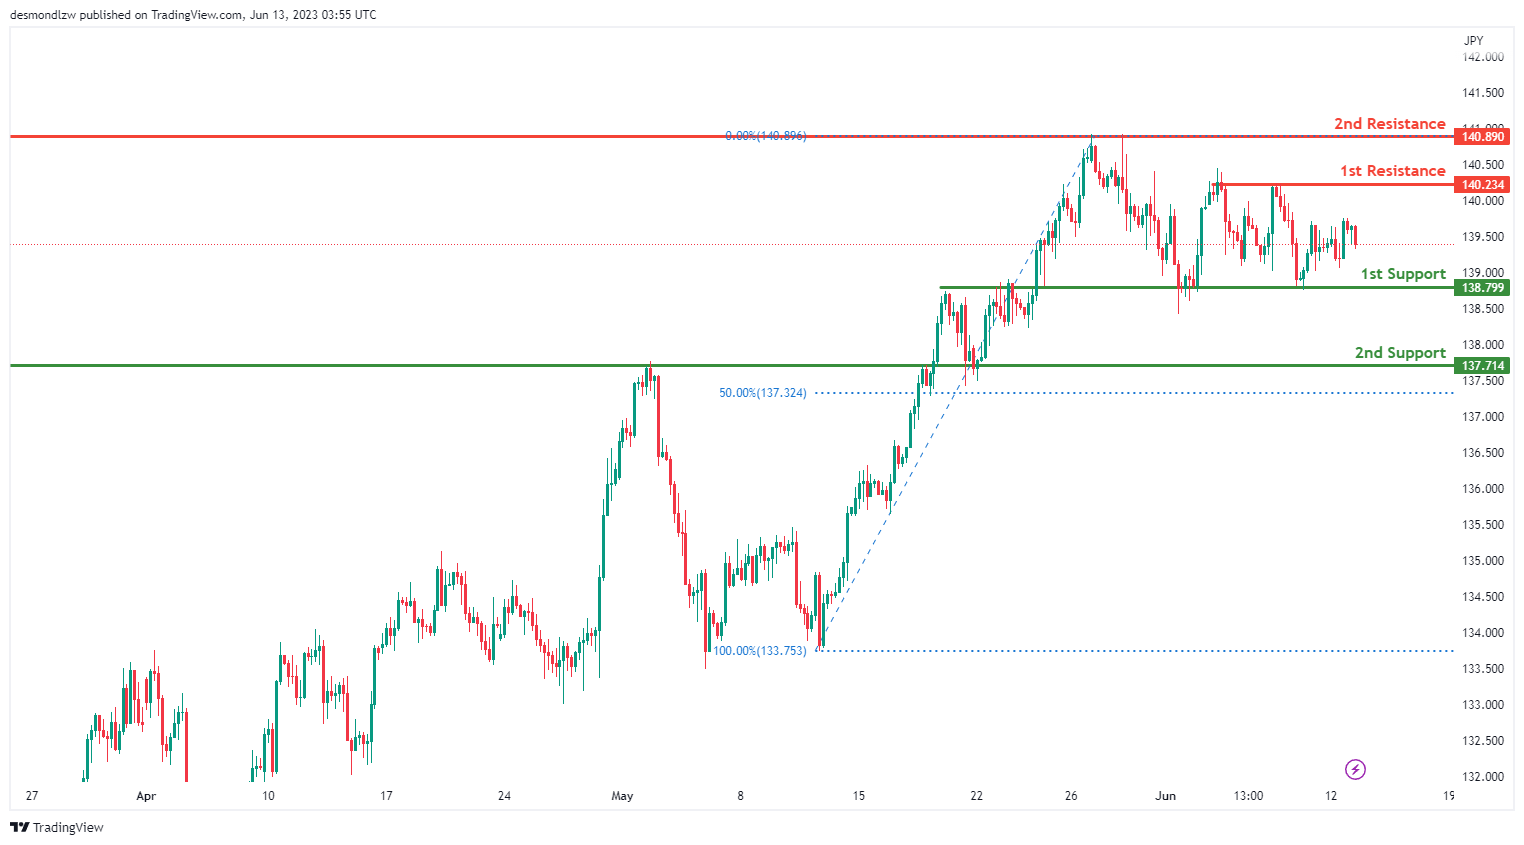
USD/JPY:
The USD/JPY chart currently exhibits a neutral momentum, indicating a lack of clear direction in price movement.
There is a potential for price to fluctuate between the first resistance level at 140.23 and the first support level at 138.80. These levels represent areas of overlap resistance and support, respectively.
Additionally, the second support level at 137.71 coincides with the 50% Fibonacci retracement, further emphasizing its significance as a potential area of support.
Similarly, the second resistance level at 140.89 is an area of overlap resistance, reinforcing its importance as a potential level where price could face resistance
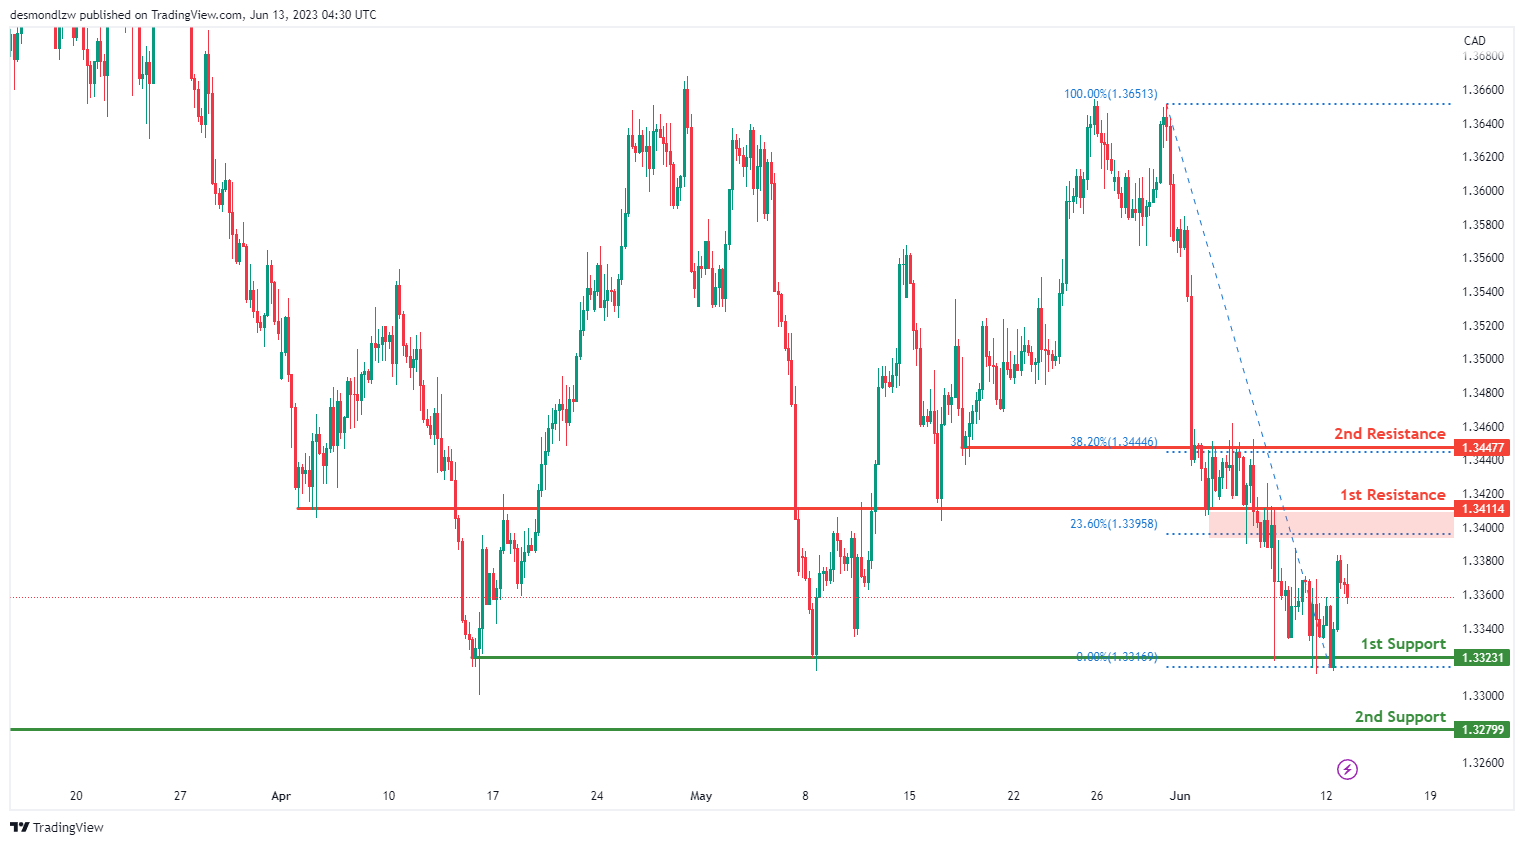
USD/CAD:
The USD/CAD chart currently exhibits a bearish momentum, indicating a downward bias in price movement.
There is a potential for a bearish continuation towards the first support level at 1.3323. This support level is significant as it represents an area of overlap support.
Additionally, the second support level at 1.3280 reinforces the potential for further downward movement, as it also represents an area of overlap support.
On the upside, the first resistance level at 1.3411 acts as a level of resistance. It is an area of overlap resistance and is further supported by the presence of a 23.60% Fibonacci retracement level.
Similarly, the second resistance level at 1.3448 also functions as an area of overlap resistance and aligns with a 38.20% Fibonacci retracement level.
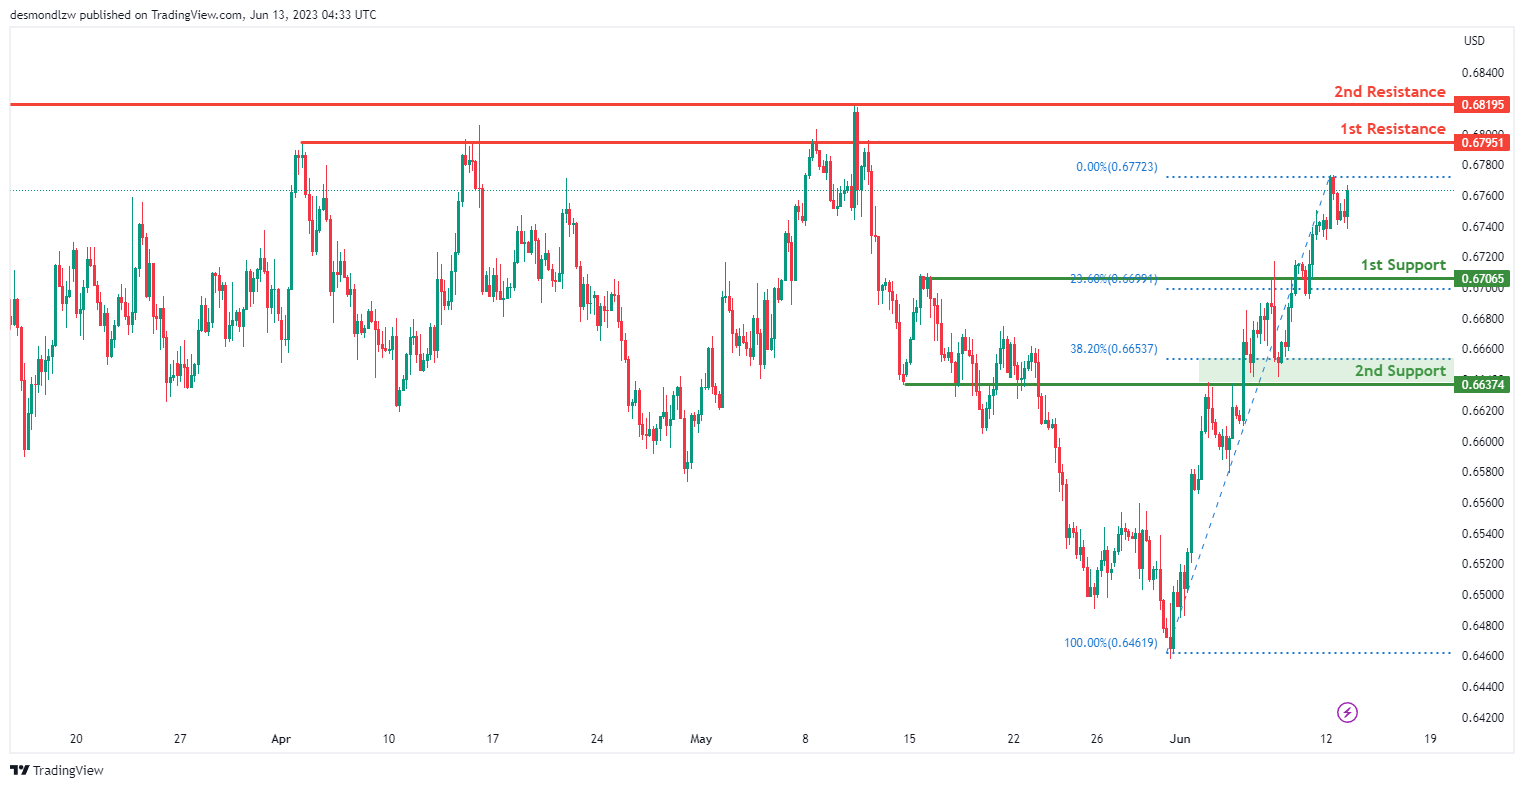
AUD/USD:
The AUD/USD chart currently shows a bullish momentum, indicating an upward bias in price movement.
There is a potential for a bullish continuation towards the first resistance level at 0.6795. This resistance level is significant as it represents an area of overlap resistance.
Furthermore, the second resistance level at 0.6820 further supports the potential for upward movement, as it also represents an area of overlap resistance.
On the downside, the first support level at 0.6707 acts as a level of support. It is an area of overlap support and is reinforced by the presence of a 23.60% Fibonacci retracement level.
Similarly, the second support level at 0.6637 functions as an area of overlap support and aligns with a 38.20% Fibonacci retracement level.
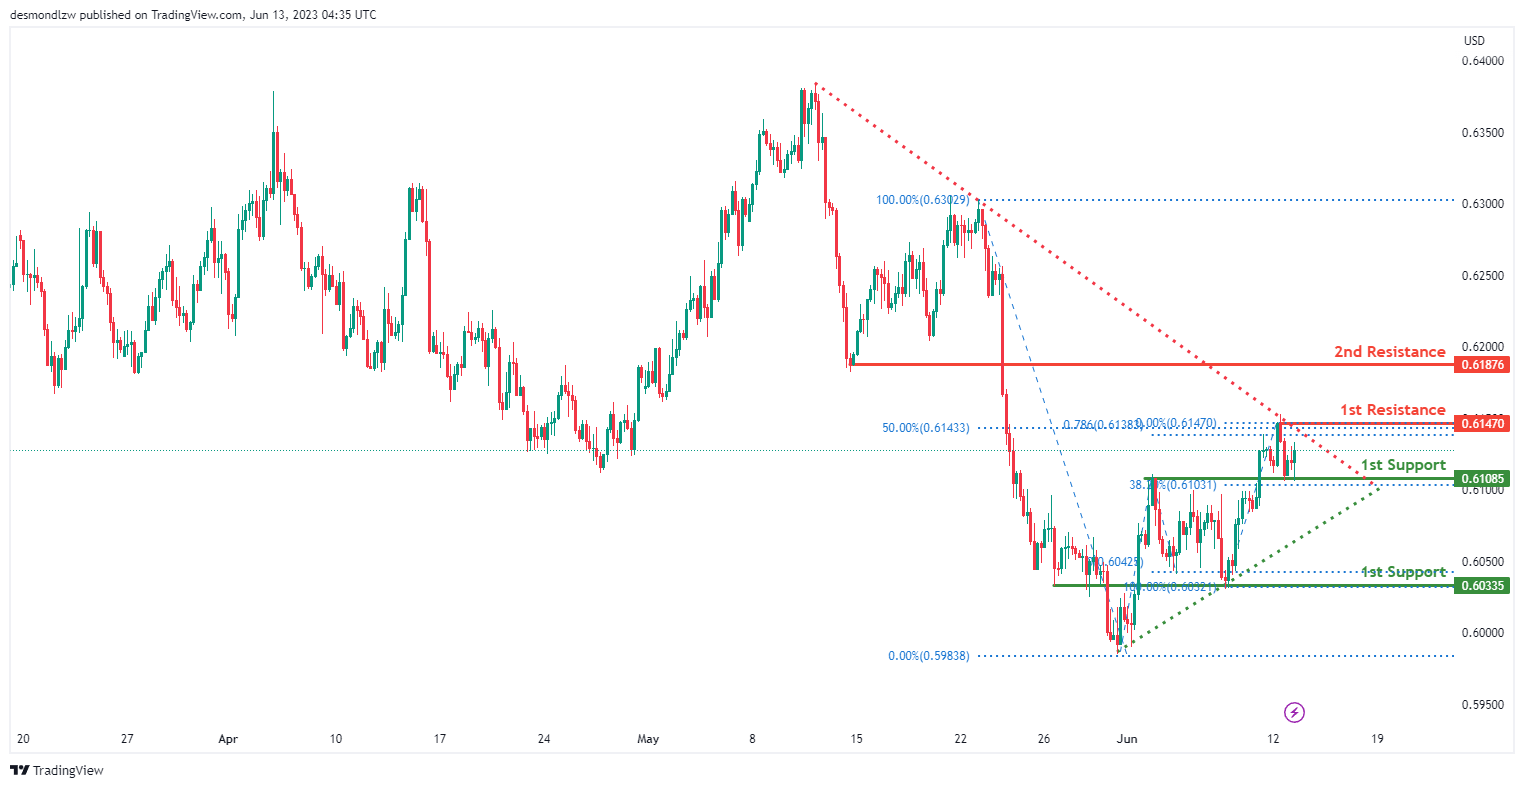
NZD/USD
The NZD/USD chart currently shows a weak bullish momentum, indicating a slight upward bias in price movement, although with low confidence.
There is a potential for a bullish continuation towards the first resistance level at 0.6147. This resistance level is significant as it represents an area of overlap resistance and is further reinforced by the presence of a 50% Fibonacci retracement level and a 78.60% Fibonacci projection.
On the downside, the first support level at 0.6109 acts as a level of support. It is an area of overlap support and is also aligned with a 38.20% Fibonacci retracement level.
Similarly, the second support level at 0.6034 functions as an area of overlap support.
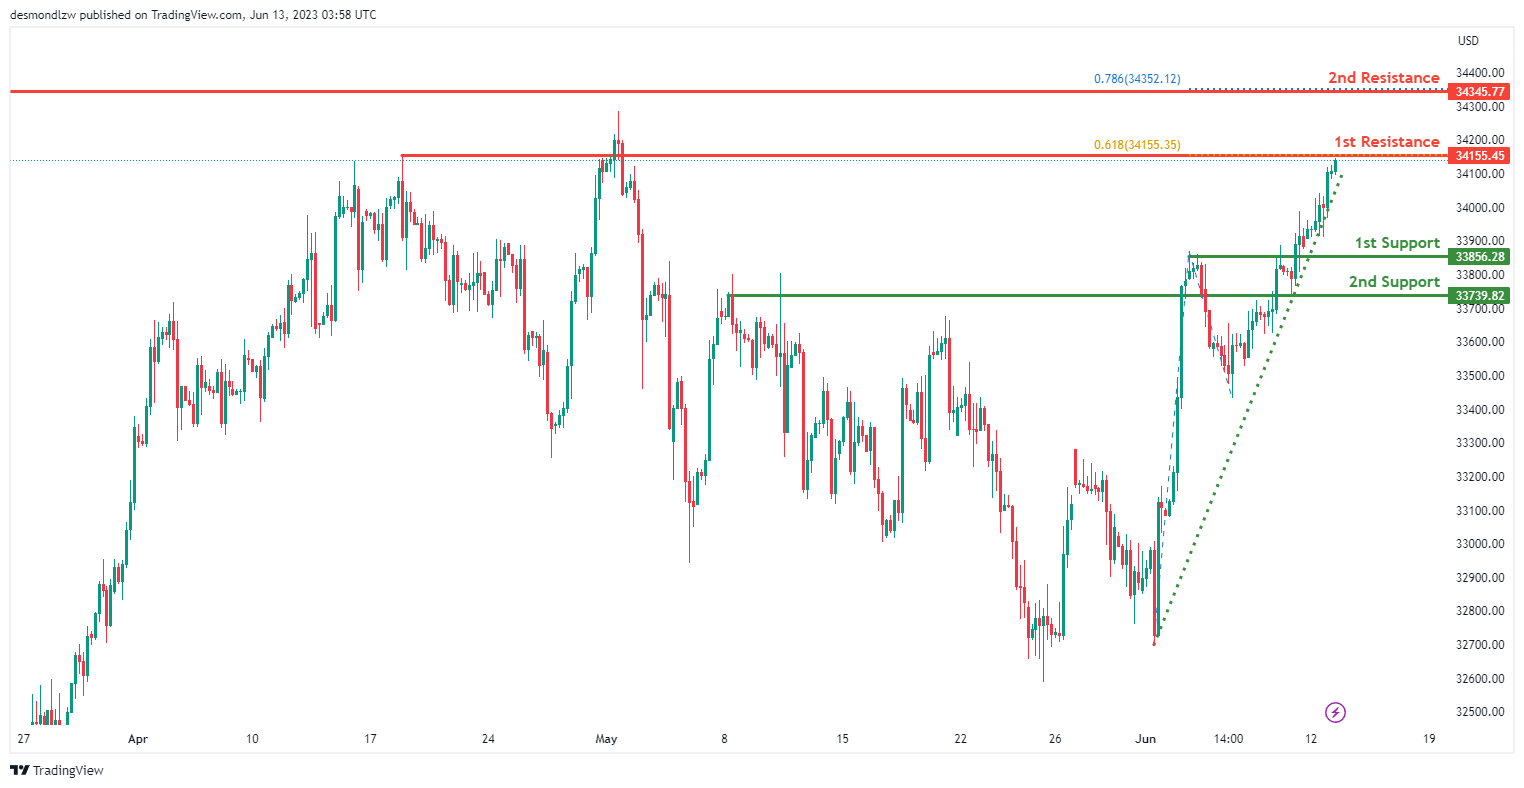
DJ30:
The DJ30 chart currently shows a bullish momentum, indicating a positive bias in price movement.
There is a potential for a bullish continuation towards the first resistance level at 34,155.45. This resistance level is significant as it represents an area of overlap resistance and coincides with the 61.80% Fibonacci projection, adding to its importance.
On the downside, the first support level at 33,856.28 and the second support level at 33,739.82 both act as areas of overlap support, providing potential levels where price could find support.
Furthermore, the second resistance level at 34,345.77 also serves as an area of overlap resistance, reinforcing its significance in potentially halting the upward movement of price.
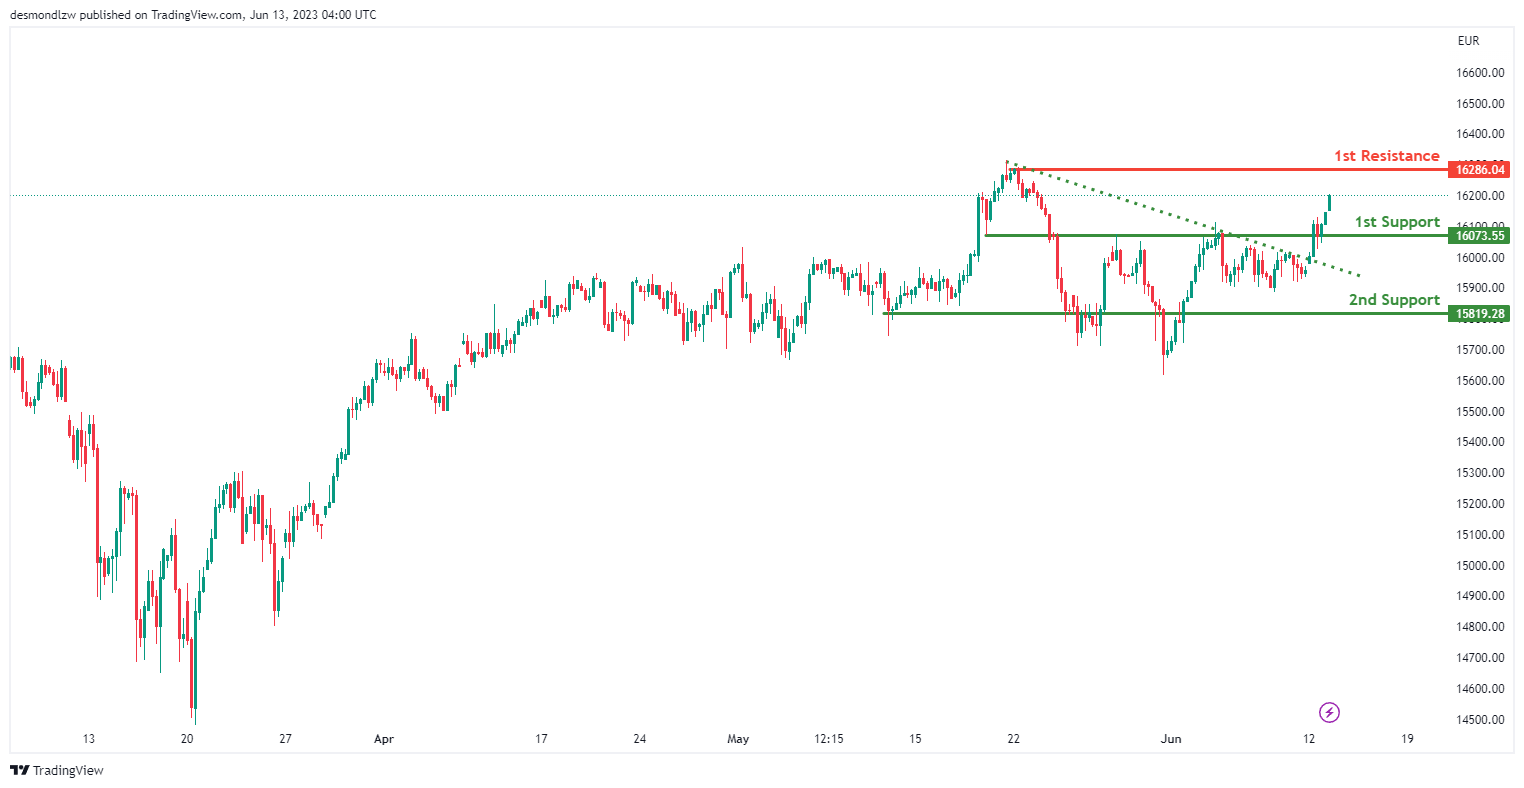
GER30:
The GER30 chart currently exhibits a bullish momentum, indicating a positive bias in price movement.
There is a potential for a bullish continuation towards the first resistance level at 16,286.04. This resistance level is significant as it represents a swing high resistance, suggesting a potential area where price could face selling pressure.
On the downside, the first support level at 16,073.55 and the second support level at 15,819.28 both act as areas of overlap support, providing potential levels where price could find support during pullbacks..
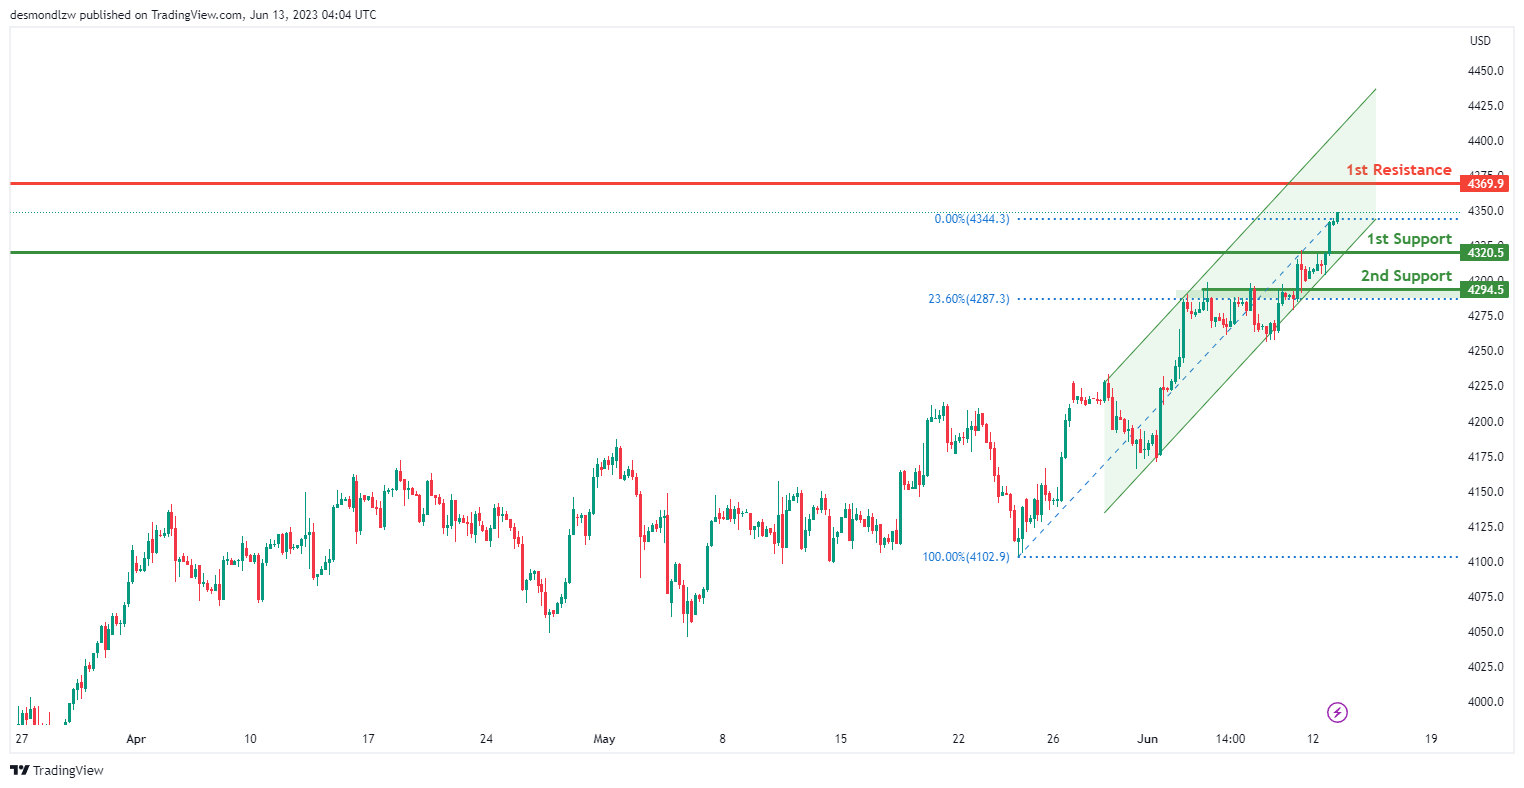
US500
The US500 chart currently shows a bullish momentum, indicating a positive bias in price movement.
There is a potential for a bullish continuation towards the first resistance level at 4369.90. This resistance level is significant as it represents an area of overlap resistance, suggesting a potential area where price could face selling pressure.
On the downside, the first support level at 4320.50 and the second support level at 4294.50 both act as areas of overlap support. These levels provide potential areas where price could find support during pullbacks.
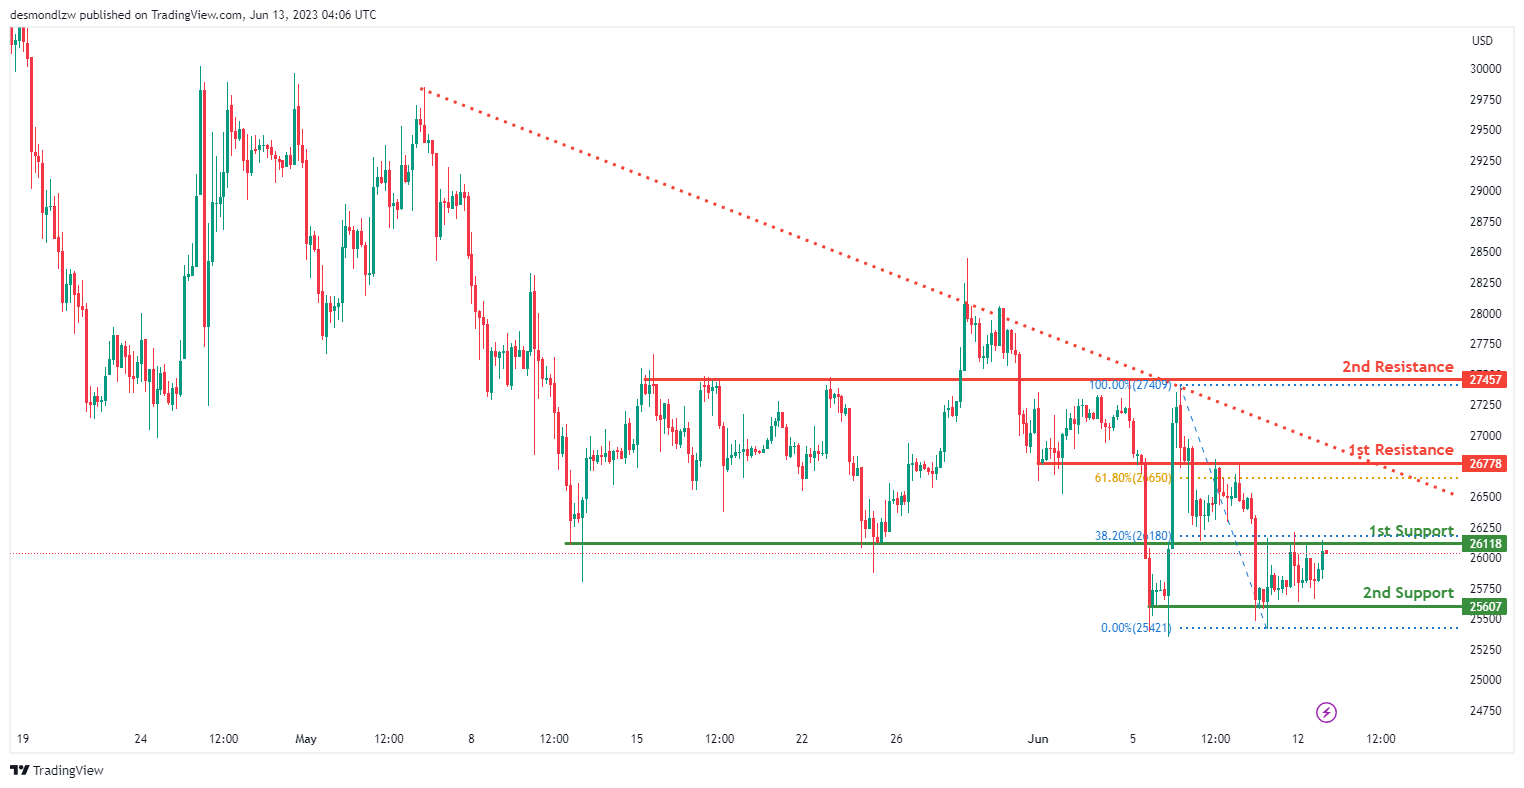
BTC/USD:
The BTC/USD chart is currently showing a neutral momentum, indicating a lack of strong directional bias in price movement.
There is a potential for price to fluctuate between the first resistance level at 26778.00 and the first support level at 26118.00. These levels are significant as they represent areas of overlap resistance and support, respectively. Additionally, the first support level is aligned with the 38.20% Fibonacci retracement level, adding further importance to this level.
On the upside, the second resistance level at 27457.00 acts as an additional area of overlap resistance, potentially providing a barrier for further upward movement.
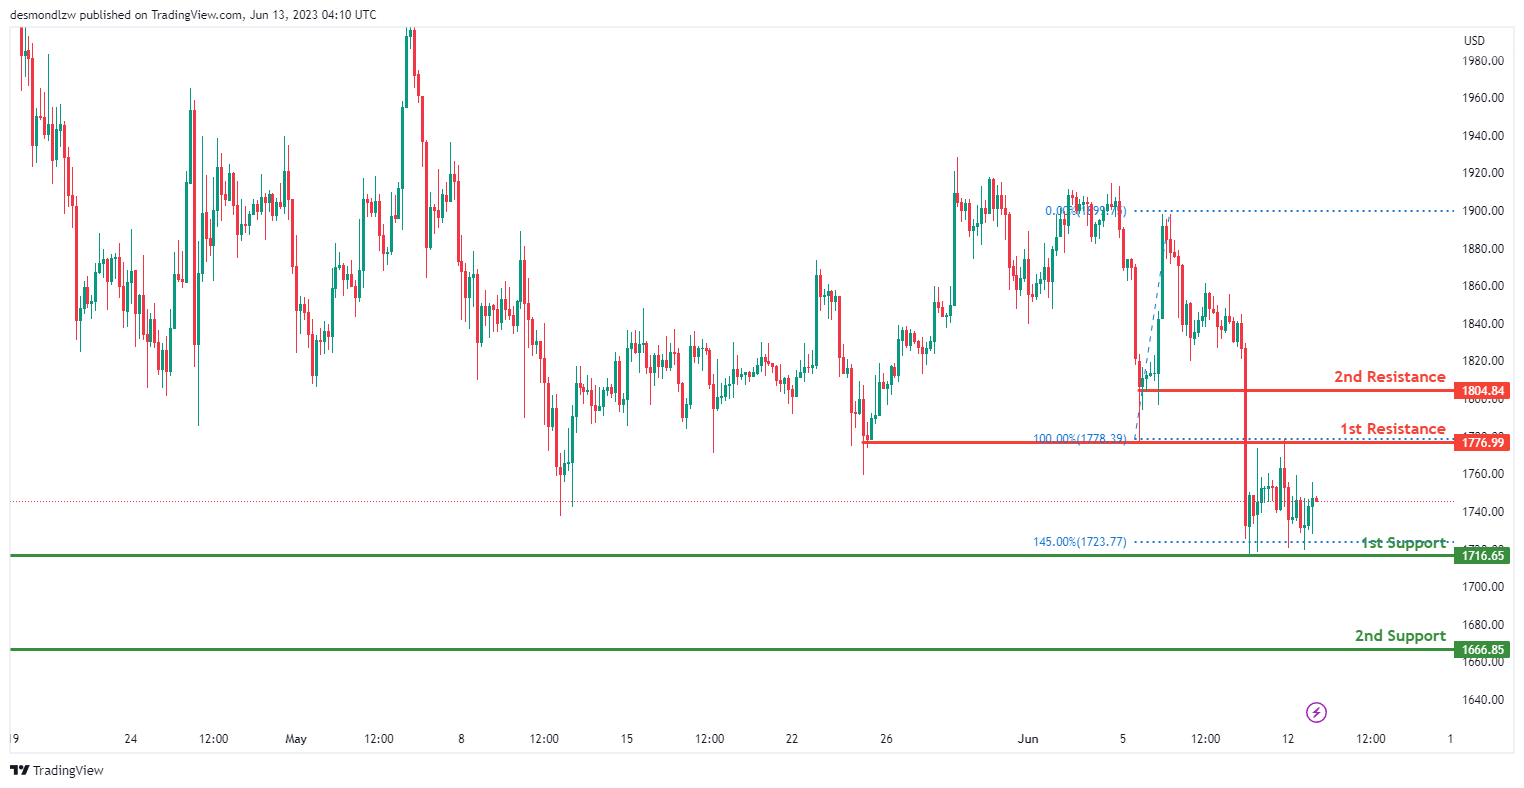
ETH/USD:
The ETH/USD chart is currently exhibiting a neutral momentum, indicating a lack of strong directional bias in price movement.
There is a potential for price to fluctuate between the first resistance level at 1776.99 and the first support level at 1716.65. These levels are significant as they represent areas of overlap resistance and support, respectively. Additionally, the first support level aligns with the 145.00% Fibonacci extension, which adds further significance to this level.
Furthermore, the second support level at 1666.85 serves as an additional area of overlap support, potentially providing a barrier for further downward movement.
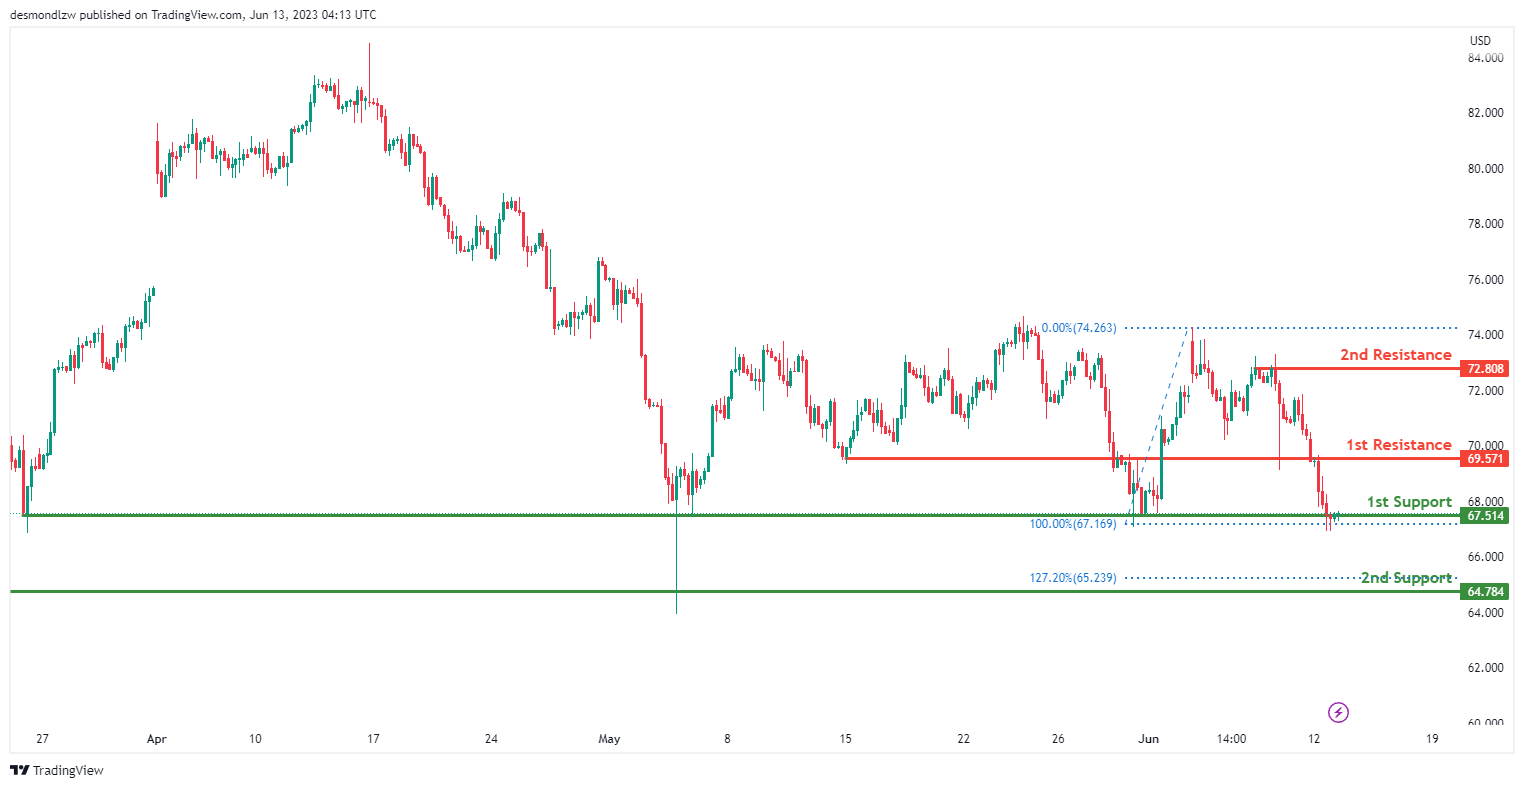
WTI/USD:
The WTI chart currently shows a bearish momentum, indicating a downward bias in price movement.
There is a potential for the price to make a bearish break below the first support level at 67.51 and drop towards the second support level at 64.78. These support levels are significant as they represent areas of overlap support. Additionally, the second support level aligns with the 127.20% Fibonacci projection, adding further significance to this level.
On the upside, the first resistance level at 69.57 acts as an area of overlap resistance, potentially causing the price to face selling pressure.
Furthermore, the second resistance level at 72.81 serves as an additional area of overlap resistance, potentially acting as a barrier for further upward movement.
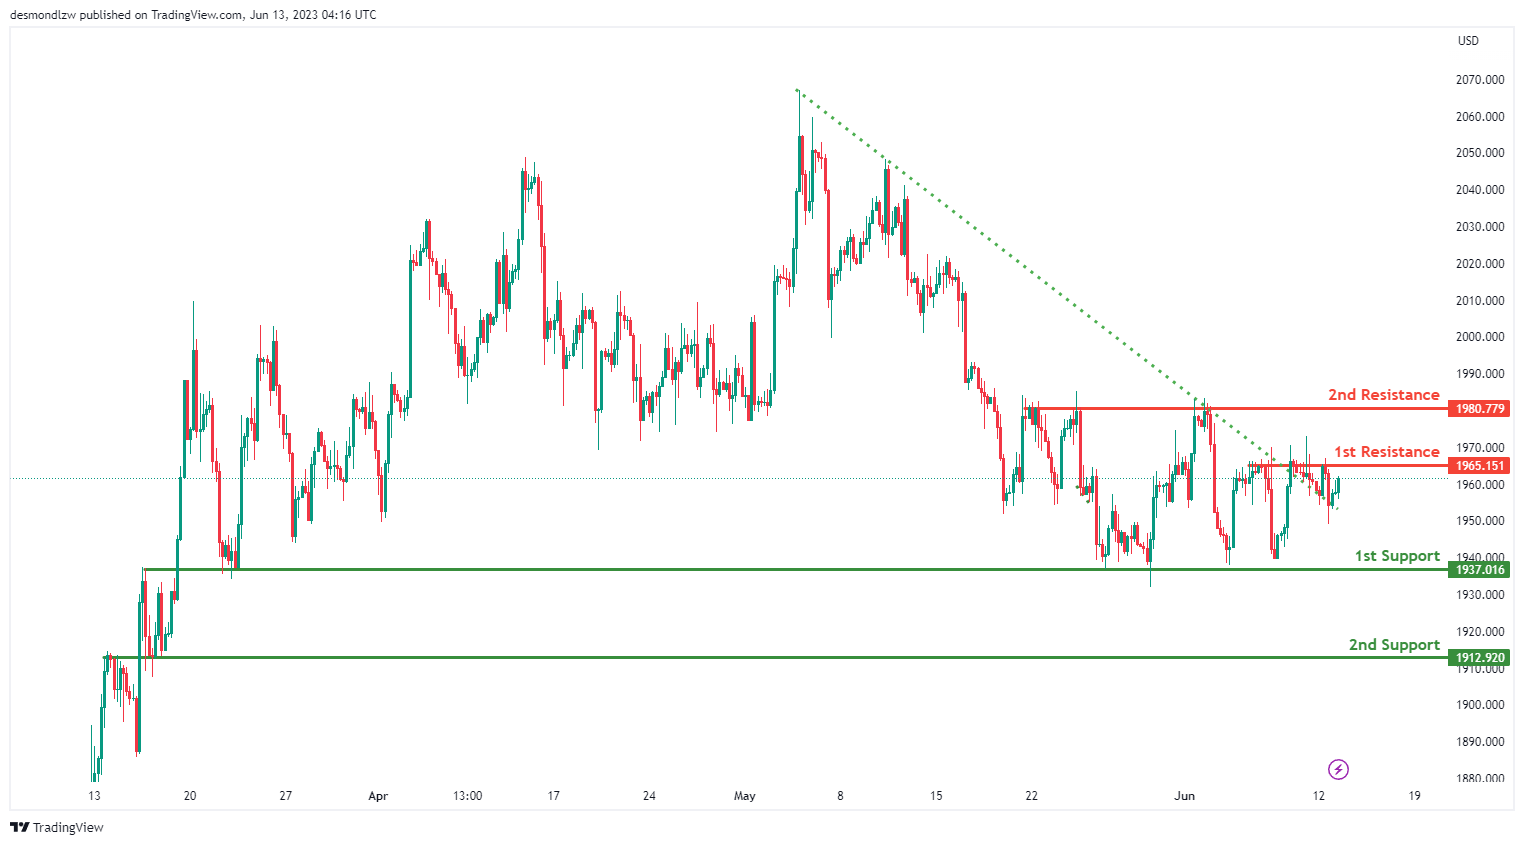
XAU/USD (GOLD):
The XAU/USD chart currently exhibits a weak bullish momentum with low confidence, suggesting a cautious outlook for price movement.
There is a potential for a bullish continuation towards the first resistance level at 1965.15. This resistance level is significant as it represents an area of overlap resistance.
On the downside, the first support level at 1937.02 acts as a notable area of support, providing potential buying pressure. Additionally, the second support level at 1912.92 is another area of overlap support, reinforcing its importance as a potential level for price to find support.
It’s important to note that the overall momentum is weak, indicating a lack of strong conviction in the upward movement. Therefore, traders should exercise caution and closely monitor price action for any signs of a sustained bullish trend.