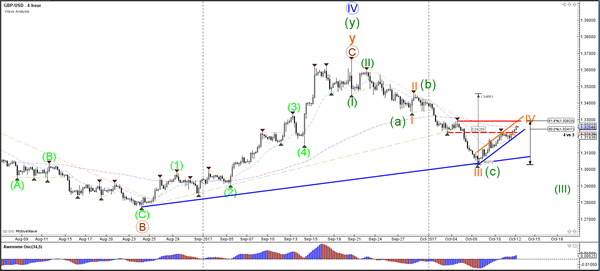
Currency pair GBP/USD
The GBP/USD bullish channel (blue/orange lines) is challenging the Fibonacci levels of wave 4 (orange). A break above the 61.8% Fib makes a wave 4 less likely and could indicate a larger bullish reversal. In that case, an ABC (green) correction has probably occurred. However, a failure to break the resistance zone but a break below the channel could spark a bearish continuation to test the outer trend line connecting the wave 3 (orange bottom).
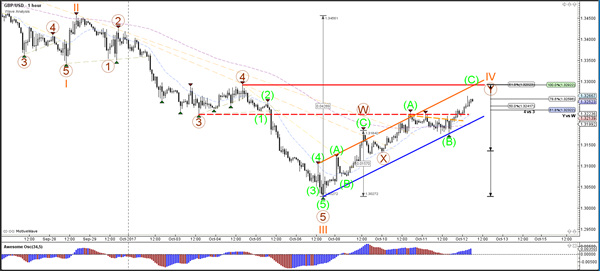
The GBP/USD bearish break below the support trend line (blue) could indicate the completion of wave 4 (orange) and the continuation of the downtrend. A break above the resistance top and 61.8% Fib makes a wave 4 less likely. For the moment an ABC (green) zigzag correction could be taking place.
Currency pair EUR/USD
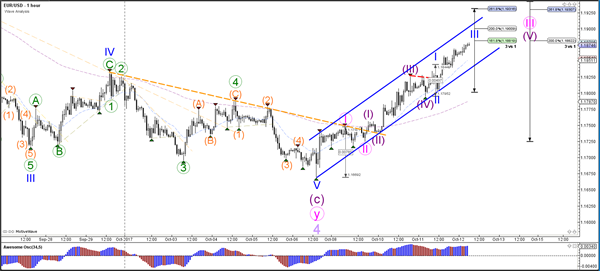
The EUR/USD bullish channel (blue lines) is now challenging a potential resistance trend line (orange). It is unclear whether price is in a wave 5 or in an expanded wave 4 at the moment, which depends on how price develops within the bullish channel.
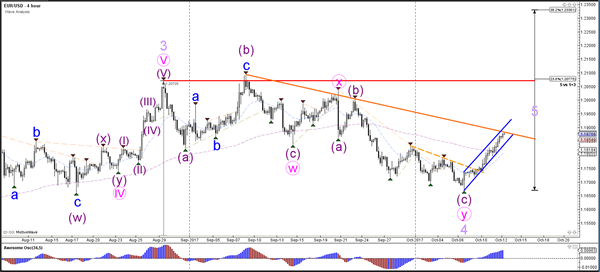
The EUR/USD bullish momentum has reached the 161.8% Fibonacci target and could be in a wave 3 (blue). A shallow retracement could indicate a potential wave 4 and a continuation within the bullish channel.
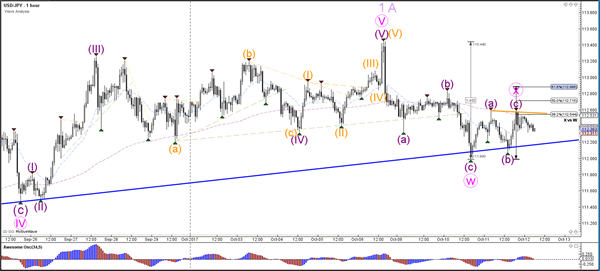
Currency pair USD/JPY
The USD/JPY could be building a larger correction within wave 2 or B (purple).
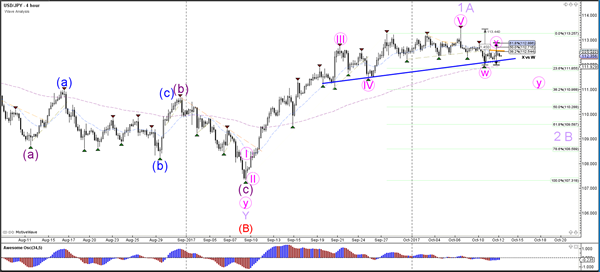
The USD/JPY could have completed a potential ABC (purple) correction within wave X (purple).