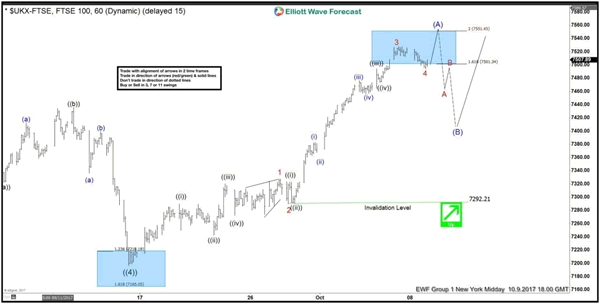
The $FTSE 100 index appears to be showing an impulsive bounce from the 9/15/17 lows. This is part of a larger leading diagonal up from the 2/11/16 lows. In an impulse that is bullish, market prices will go up in an impulsive manner on all time frames of trend. Impulses are always subdivided into smaller degree impulse waves and will alternate between the impulsive motive and corrective character so that the waves 1, 3, and 5 are impulses and the waves 2 and wave 4 are smaller pullback retraces of the waves 1 and 3.
In the near term, ideally while the index is above the 7493 wave 4 lows it can see the 5th wave target area in the 7535 to 7624 region in the intermediate blue wave (A) degree before it ends a cycle up from the 9/15 lows. The minimum target mentioned at 7535 comes from the inverse extension measurement of the depth of wave 4. The higher target area up at 7624 is where wave 5 equals wave 1. In between the upper and lower target areas the .618 extension of the wave 1 and wave 3 combined give a target area at 7574. Feel free to have a look at this blog title "How to get an Elliott Wave fifth wave target" that mentions how and the three ways to get a wave 5 target here. Afterward of completing the cycle up from the 9/15/17 lows the index should develop a three, seven or eleven wave corrective pullback in intermediate degree wave (B) that should offer the next best buying opportunity in the equity index. Here is another blog that references corrective structures of what to look for in that pullback.

