Currency pair GBP/USD
The GBP/USD is building a bullish retracement in the downtrend channel (red line) which could be part of a larger wave C or 3 (green).
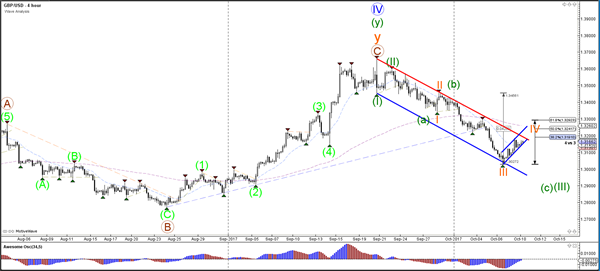
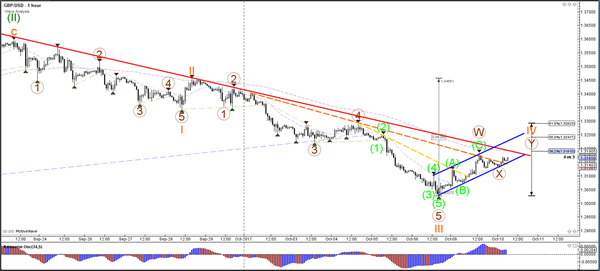
The GBP/USD is probably building a deeper bullish retracement via a wave 4 (orange). This wave 4 (orange) becomes less likely if price breaks above the downtrend channel and 50% Fib. A bearish break below the bullish channel (blue) could indicate the continuation of the downtrend.
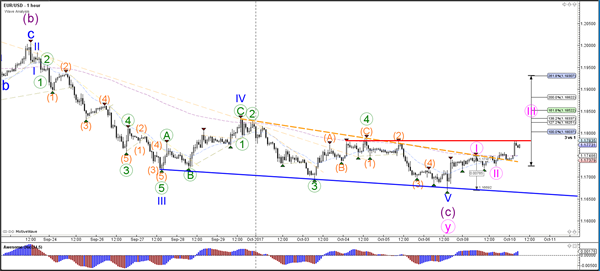
Currency pair EUR/USD
The EUR/USD broke above the falling wedge chart pattern (dotted orange), which indicates a bullish bounce at the 23.6% Fibonacci level of wave 4 (purple). The wave 4 does not have to be completed. This depends on whether price makes a bullish ABC or 12345 pattern when challenging the next resistance trend lines.
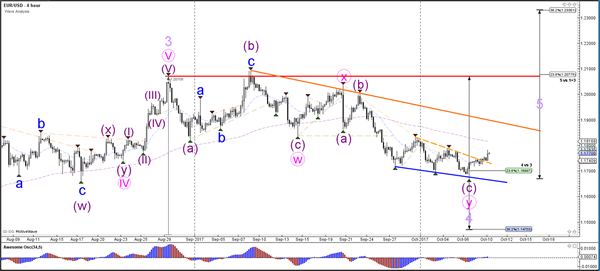
The EUR/USD wave structure has multiple options at this moment but a wave 3 (pink) is more likely if price manages to break above the resistance trend line (red).
Currency pair USD/JPY
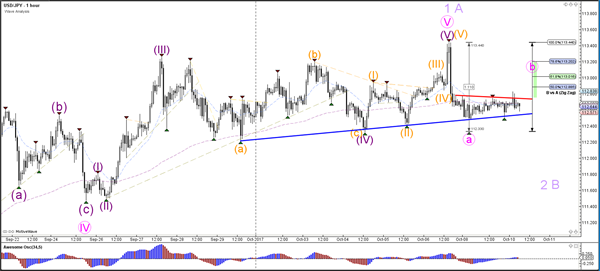
The USD/JPY is in a sideways range, which is indicated by the support (blue) and resistance (red) trend lines. A bearish breakout could indicate a retracement towards the Fibonacci levels of wave 2 or B (purple).
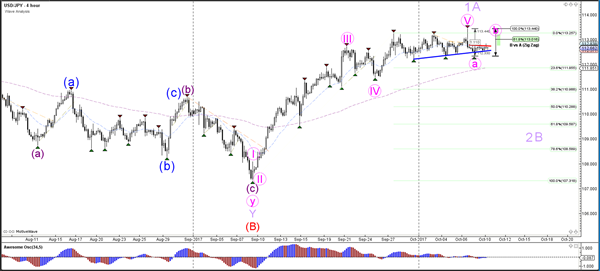
The USD/JPY could be building a potential ABC (pink) correction.
