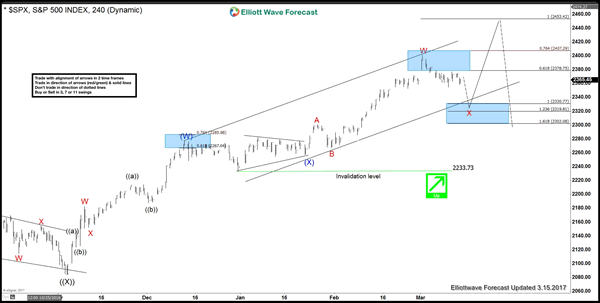
Elliott Wave sequence analysis of SPX Index from 11/4/2016 low (2083.79) suggests the Index is rallying in a 5 swing bullish sequence and has not reached the 100% – 123.6% target area of 2453 – 2500. The structure of the rally is unfolding as a double three WXY Elliott wave structure or often called a 7 swing structure. Up from 2083.79, Intermediate wave (W) or third swing ended at 2277.53 and Intermediate wave (X) or fourth swing ended at 2257.02. The Index has since broken above 2277.53 and extended higher. SPX is currently in the 61.8 – 76.4 extension area (2378.75 – 2407.29) of the Intermediate wave (W) and wave (X) where fifth swing usually ends. The fifth swing or Minor wave W is proposed complete at 2400.98 within above area and a pullback in Minor wave X or the sixth swing is expected to take place to correct rally from 12/30/2016 low (2233.73).
4 Hour SPX Index Elliott wave chart

We believe SPX correction lower is going to take place as RUT (Russell 2000) has already corrected lower and also showing incomplete sequence to the downside. When we look at Russell and other instrument in the market, the overall market correlation suggests SPX should pull back in Minor wave X. Once the pullback is over, then the Index should rally again towards new high at 2453 – 2500 area. We don’t like selling the Index and expect dip buyers to appear once Minor wave X pullback is complete for a new high or at least 3 waves bounce.
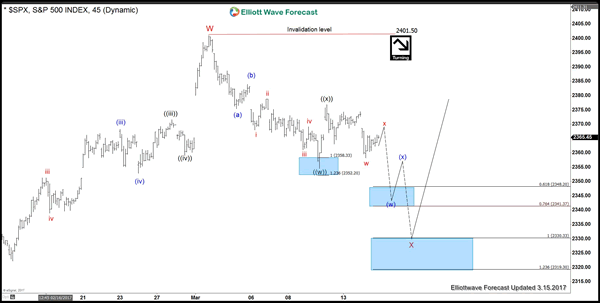
1 Hour SPX Index Elliott wave chart

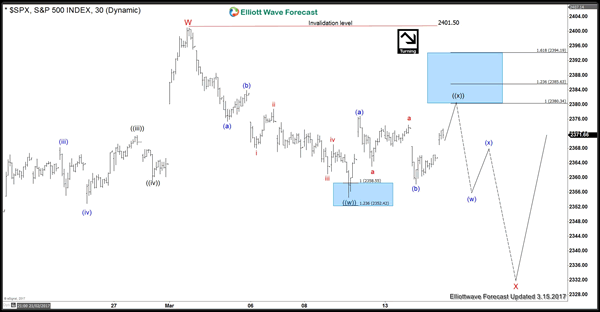
The 1 hour Elliott wave view above suggests that while the Index stays below wave ((x)) at 2376.86, it is expected to turn lower within Minute wave ((y)) towards 2319.3 – 2330.33 area to end Minor wave X pullback. In the above mentioned area, the Index is expected to find buyers and would have a chance to extend rally in 7th swing to a new high towards 2453 – 2500 area or at least bounce in 3 waves. If Russell does a FLAT from 3/9 low, then SPX could still see 2380 – 2385 area to complete wave ((x)) as a FLAT before making the next push lower to complete wave X pull back. We do not like selling the proposed pullback as the Elliott wave sequence in the higher degree from 11/4/2016 low remains bullish and prefer to use the dips as a buying opportunity at
1 Hour SPX Index Chart with FLAT wave ((x))

