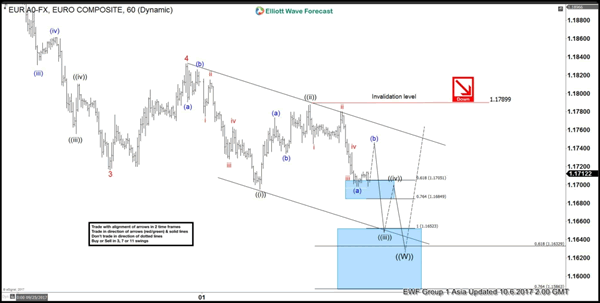
EURUSD Intra-Day Elliott Wave view suggests the decline from 9/8 peak remains in progress as an expanded Flat Elliott Wave structure. Down from 9/8 high (1.2094), pair ended Intermediate wave (A) at 1.837. Bounce to 1.2034 ended Intermediate wave (B). Intermediate wave (C) remains in progress and unfolding as 5 waves impulse where Minor wave 1 of (C) ended at 1.186, and Minor wave 2 of (C) ended at 1.2. Down from there, Minor wave 3 of (C) ended at 1.1716 and bounce to 1.1832 ended Minor wave 4 of (C).
While EURUSD stays below 1.1789, it has scope to extend lower in Minor wave 5 of (C) and reach 1.1586 – 1.1633 area. The move lower will also end cycle from 9/8 peak and complete Primary wave ((W)). Afterwards, Pair should bounce in Primary wave ((X)) to correct cycle from 9/8 peak in 3, 7, or 11 swing at least. If pair breaks above 1.17899 from here without making a new low, pair may have ended Primary wave ((W)) already.
EURUSD 1 Hour Elliott Wave Chart

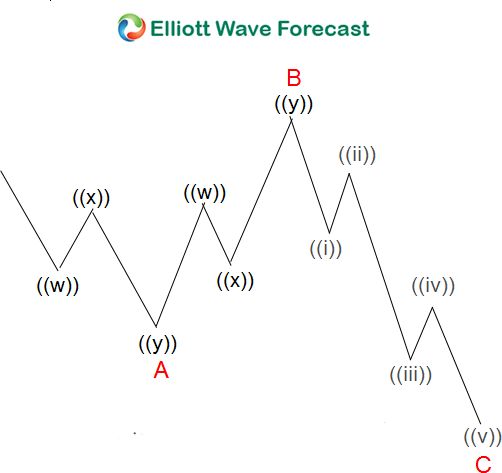
Expanded Flat is a 3 waves corrective pattern, and the inner subdivision is labeled as A,B,C with 3,3,5 structure. That means waves A and B are always corrective structures i.e. could be WXY, WXYXZ, Zigzag or any 3 waves corrective pattern. Wave C is either 5 waves impulse or ending diagonal pattern. In the graphic below, we can see what Expanded Flat structure looks like. Inner structure has ABC labeling, where wave B can complete below or above the starting point of wave A. Wave C should complete below the end point of wave A (usually at 1.236-1.618 fibonacci extension A related to B).

