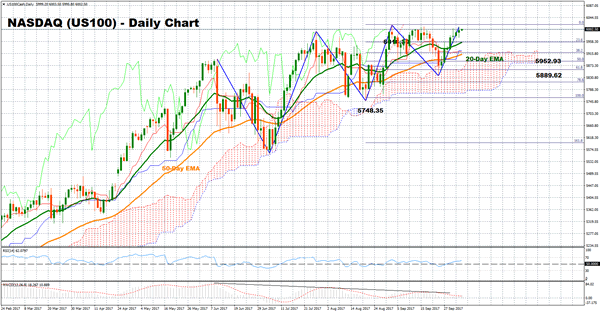
The tech-heavy US100 index is currently trying to post another green candle around record high levels, stretching its upleg started on September 26. The outlook in the short- and medium-term remains bullish based on oscillator signals. However, momentum has slowed down, hinting to softer upside movement in the short-term.
The RSI has entered bullish territory above 50 at the end of September and is currently positively sloped, suggesting a bullish picture in the short-term. The MACD is also above zero and its signal line but the fact that it has been making lower highs since June highlights that the index might be losing steam. This could also be seen from the last recorded top not being far above the previous peak. Additionally, the Kijun-sen recently moved below Tenkan-sen; this being a negative alignment.
A break above the previous September 1 high of 6016.30 would confirm the continuation of the long-term uptrend and the posting of new record highs. Further extensions would target the 6100 psychological level before the 6200 key mark comes into view.
If the index retreats, support could be first found around the 23.6% Fibonacci point of the upleg from 5748.38 to 6016.30 (August 21- September 1) at 5952.93 which is also where the 20-day exponential moving average (EMA) lays. Next, the focus would shift to the 50% Fibonacci at 5889.62 with the outlook turning to neutral in case the index violates that point. Further declines would turn the attention to the August 21 low of 5748.35 which is also near the bottom of the Ichimoku cloud.
In the medium-term, the outlook remains positive as long as the bullish cross between the 20-day EMA and the 50-day EMA remains in place.

