
A note on lower timeframe confirming price action…
Waiting for lower timeframe confirmation is our main tool to confirm strength within higher timeframe zones, and has really been the key to our trading success. It takes a little time to understand the subtle nuances, however, as each trade is never the same, but once you master the rhythm so to speak, you will be saved from countless unnecessary losing trades. The following is a list of what we look for:
- A break/retest of supply or demand dependent on which way you’re trading.
- A trendline break/retest.
- Buying/selling tails … essentially we look for a cluster of very obvious spikes off of lower timeframe support and resistance levels within the higher timeframe zone.
- Candlestick patterns. We tend to only stick with pin bars and engulfing bars as these have proven to be the most effective.
We typically search for lower-timeframe confirmation between the M15 and H1 timeframes, since most of our higher-timeframe areas begin with the H4. Stops are usually placed 1-3 pips beyond confirming structures.
EUR/USD
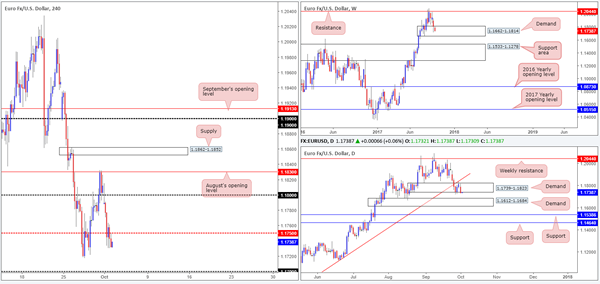
The euro, as you can see, opened the week lower against its US counterpart, consequently placing H4 price beneath the 1.18 handle. The bearish pulse continued to beat throughout the day, eventually wiping out bids around the mid-level support at 1.1750 on stronger-than-expected US ISM manufacturing data.
With 1.1750 engulfed, the 1.17 handle, followed closely by a H4 Quasimodo support at 1.1681, is likely next on tap. Over on the bigger picture, however, weekly price remains trading within the walls of demand at 1.1662-1.1814. Meanwhile, daily action shows the unit confronting the lower edge of demand coming in at 1.1739-1.1823, which could indicate that the pair may be eyeing demand seen below at 1.1612-1.1684.
Suggestions: Watch for H4 price to test 1.17 today and look for the fakeout down to the nearby H4 Quasimodo support level at 1.1681. Psychological numbers are typically prone to fakeouts due to the amount of orders that these levels attract. This – coupled with the fact that the Quasimodo is also positioned around the top edge of daily demand mentioned above at 1.1612-1.1684 and located within the lower limits of the said weekly demand, makes this is a high-probability buy, in our opinion.
Data points to consider: FOMC member Powell speaks at 1.30pm GMT+1.
Levels to watch/live orders:
- Buys: Watch for H4 price to fake through 1.17 and attack H4 Quasimodo support at 1.1681 ([waiting for a H4 bullish pin-bar to form here is advised] stop loss: either beyond the fakeout candle’s tail or beneath the lower edge of weekly demand at 1.1660).
- Sells: Flat (stop loss: N/A).
GBP/USD
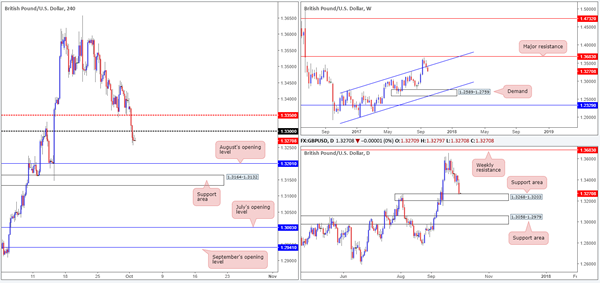
The British pound suffered going into yesterday’s sessions as the sellers pummeled the market from the word go! Aided by a less-than-stellar UK Manufacturing PMI print, H4 action ended the day firmly crossing below the 1.33 handle. Should the bears remain in the driving seat here, the next port of call will likely be August’s opening level pegged at 1.3201, shadowed closely by a support area seen at 1.3164-1.3132.
Looking over to the higher timeframes, weekly price recently re-entered the ascending channel formation (1.1986/1.2673). We know there’s a lot of ground to cover, but this move could have potentially opened up downside to as low as the demand area positioned at 1.2589-1.2759. On the flip side, daily activity is currently seen challenging the top edge of a support area coming in at 1.3268-1.3203. A violation of this area will likely clear the river south down to as far as another support area seen at 1.3058-1.2979.
Suggestions: Shorting based on weekly structure is a little too risky for our liking, considering the position of daily price right now. For that reason, shorting below 1.33 is not something we’re going to be taking part in.
Data points to consider: UK Construction PMI at 9.30am. FOMC member Powell speaks at 1.30pm GMT+1.
Levels to watch/live orders:
- Buys: Flat (stop loss: N/A).
- Sells: Flat (stop loss: N/A).
AUD/USD
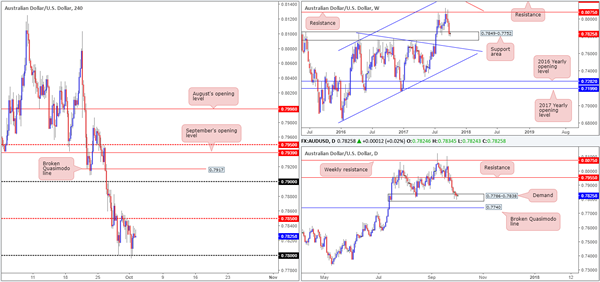
Kicking off this morning’s report with a quick look at the weekly chart, we can see that buyers and sellers remain battling for position within the walls of a support area penciled in at 0.7849-0.7752. This zone has a strong history and held well as support during the month of August, thus there’s a good chance that we may see history repeat itself here. In support of the current weekly zone, a strong daily demand base logged at 0.7786-0.7838 is seen painted within its boundaries. While as of current price the market is bid from this daily barrier, traders might want to note that should this area give way, the next port of call will likely be a nearby broken daily Quasimodo line seen at 0.7740.
As expected, H4 price drove lower in opening trade on Monday and attempted to breach the 0.78 handle. The unit, as far as we can tell, is well-bid from this psychological level given that the number is positioned within the higher-timeframe support areas!
Suggestions: As of current price, we see two possible setups:
Wait for H4 price to CLOSE above the nearby mid-level resistance at 0.7850, and then look to trade any retest seen thereafter, targeting the 0.79 handle, followed closely by a broken Quasimodo line at 0.7917.
As stop-loss orders are still likely active beneath 0.78, a whipsaw through this number in the shape of a H4 buying tail (pin bar) would be attractive. Once/if this is seen, traders could look to become buyers on the candle close, targeting 0.7850 as an initial take-profit zone.
Data points to consider: RBA interest rate decision and statement at 4.30am. FOMC member Powell speaks at 1.30pm GMT+1.
Levels to watch/live orders:
- Buys: 0.78 region ([watch for a H4 pin-bar candle to whipsaw through this number before pulling the trigger] stop loss: ideally beyond the pin bar’s tail). Watch for H4 price to engulf 0.7850 and then look to trade any retest seen thereafter ([waiting for a H4 bullish candle to form in the shape of a full or near-full-bodied candle following the retest is advised] stop loss: ideally beyond the candle’s tail).
- Sells: Flat (stop loss: N/A).
USD/JPY:
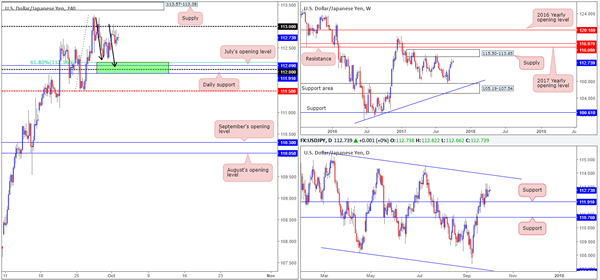
During the course of Monday’s sessions, the USD/JPY advanced north in early trading and crossed swords with the 113 handle. As you can see though, the pair failed to sustain gains beyond this psychological number and managed to clock a low of 112.53 amid US opening trade.
Assessing the weekly chart’s structure, the piece looks poised to challenge nearby supply coming in at 115.50-113.85. In conjunction with weekly flow, we can also see daily price respecting support at 111.91 and showing space for the unit to move north up to at least the trendline resistance extended from the high 115.50 (intersects with the aforementioned weekly supply zone).
The road to 112 remains in view and is still, as highlighted in Friday’s report, an incredibly appealing level at the moment. Here’s why:
Positioned directly above daily support at 111.91.
Located just below July’s opening level at 112.09.
Nearby a 61.8% H4 Fib support at 112.16 taken from the low 111.47.
H4 AB=CD completion point at 112.06 (see black arrows).
Suggestions: With space seen for both weekly and daily action to push higher, coupled with the 112 handle’s surrounding confluence mentioned above, a long from the green H4 buy zone is worthy of attention. As psychological levels are prone to fakeouts, however, you may want to wait for H4 price to confirm buyer intent before pulling the trigger. For us, this would simply be a full or near-full-bodied bullish candle formed within the green zone, which would, in our view, provide enough evidence to hold the position up to at least 113/H4 supply at 113.57-113.38.
Data points to consider: FOMC member Powell speaks at 1.30pm GMT+1.
Levels to watch/live orders:
- Buys: 111.91/112.16 ([waiting for a reasonably sized H4 bullish candle to form – preferably a full, or near-full-bodied candle – is advised] stop loss: ideally beyond the candle’s tail).
- Sells: Flat (stop loss: N/A).
USD/CAD
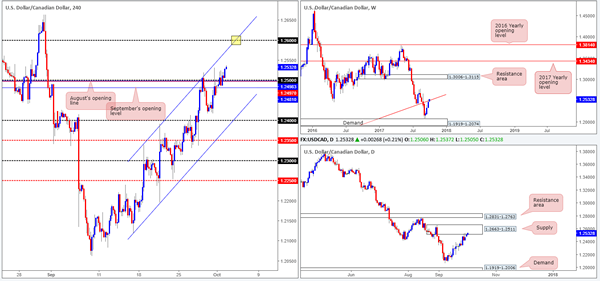
Reinforced by a robust US dollar and an upbeat US ISM Manufacturing PMI, the USD/CAD conquered the 1.25 handle on Monday and tapped a high of 1.2524 on the day. Although daily action resides within supply seen at 1.2663-1.2511 and weekly price at a trendline resistance extended from the low 0.9633, H4 price shows room to advance up to the 1.26 handle which happens to fuse beautifully with a channel resistance etched from the high 1.2338 (yellow rectangle).
Suggestions: In view of the unit’s position on both the weekly and daily charts, we would strongly advise not buying this market today since one can never really know when higher-timeframe sellers will make an appearance! This –
coupled with the pair trading in a clear downtrend at the moment, we feel price is extremely overbought. To that end, the best course of action we feel is to simply wait and see if H4 price connects with 1.26 for a high-probability sell trade.
Data points to consider: FOMC member Powell speaks at 1.30pm GMT+1.
Levels to watch/live orders:
- Buys: Flat (stop loss: N/A).
- Sells: 1.26 region [waiting for a reasonably sized H4 bearish candle to form – preferably a full, or near-full-bodied candle – is advised] stop loss: ideally beyond the candle’s wick).
USD/CHF
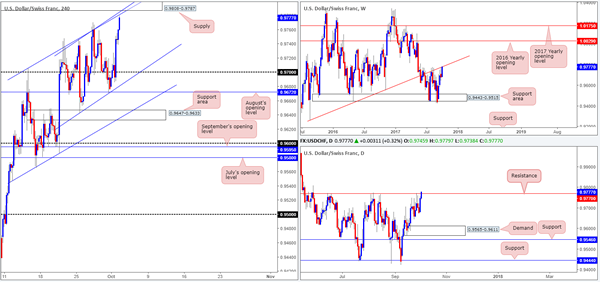
The impact of Monday’s hotter-than-expected US ISM Manufacturing PMI print saw the USD/CHF springboard north. Following this, the pair remained in a bullish state and has just this minute connected with two H4 channel resistances etched from highs of 0.9705/0.9746. It might also be worth noting that directly above these lines is a H4 supply zone pegged at 0.9808-0.9787 that houses the 0.98 handle.
Over on the bigger picture, weekly price is currently kissing the underside of a trendline resistance extended from the low 0.9257. In addition to this, traders may have also noticed that daily flow is trading around resistance fixed at 0.9770.
Suggestions: Owing to the collective resistances seen on each timeframe, today’s spotlight will firmly be focused on shorts. As such, a pending sell order has been set at 0.9787 (the underside of the current H4 supply) and a stop positioned above the zone at 0.9810. Ultimately, we will be looking to trail this position down to the 0.97 neighborhood.
Data points to consider: FOMC member Powell speaks at 1.30pm GMT+1.
Levels to watch/live orders:
- Buys: Flat (stop loss: N/A).
- Sells: 0.9787 ([pending order] stop loss: 0.9810).
DOW 30
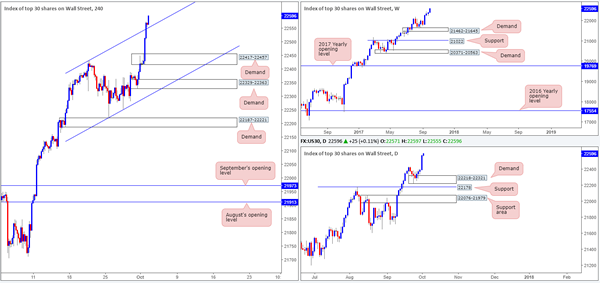
US stocks aggressively extended recent gains, pushing the index to a fresh record high of 22575! The move, as far as we can tell, was not only influenced by upbeat US data but also over the tax reform plans proposed by the Trump administration.
With H4 price now trading proud above a recently broken channel resistance extended from the high 22431, we see little reason why the market will not continue to punch higher today.
Suggestions: To take advantage of any potential move north, we would strongly recommend waiting for H4 price to pullback and retest the recently broken channel resistance as support. A retest, coupled with a reasonably strong H4 bull candle (a full or near-full-bodied candle) would, in our technical view, be ideal buying conditions.
Data points to consider: FOMC member Powell speaks at 1.30pm GMT+1.
Levels to watch/live orders:
- Buys: Watch for H4 price to retest channel support ([waiting for a reasonably sized H4 bullish candle to form – preferably a full, or near-full-bodied candle – following the retest is advised] stop loss: ideally beyond the candle’s tail).
- Sells: Flat (stop loss: N/A).
GOLD
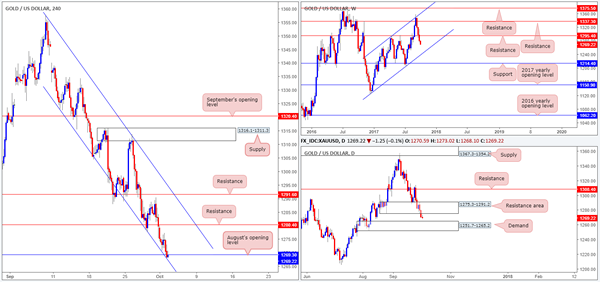
Across the board the US dollar gravitated north on Monday, consequently pressuring the yellow metal lower.
As can be seen on the H4 timeframe this morning, the buyers and sellers are currently battling for position around August’s opening level at 1269.3 which happens to merge nicely with a channel support chalked in from the low 1323.0.
Supporting a bounce from this angle is the daily USDX chart which is now within striking distance of crossing swords with a channel resistance etched from the high 12635. Conversely, however, daily action on gold shows we may see price extend down to nearby demand painted at 1251.7-1265.2, after the unit broke through demand at 1275.3-1291.2 (now acting resistance area). The flip side to this is the weekly chart. Last week’s breach of support at 1295.4 (now acting resistance) opens the door for further selling down to as far as the channel support extended from the low 1122.8.
Suggestions: As much as we want to long August’s opening level at 1269.3, the threat of further selling on the bigger picture is just too great for us at this time (see above in bold). So, why not sell then? Good question! This, unfortunately, would equally place one in a difficult position, in our view. Not only would you be selling into a monthly opening level and H4 converging channel support, you’d also have to contend with possible buying from nearby daily demand mentioned above at 1251.7-1265.2.
Therefore, remaining on the sidelines may be the better path to take today.
Levels to watch/live orders:
- Buys: Flat (stop loss: N/A).
- Sells: Flat (stop loss: N/A).