EUR/USD
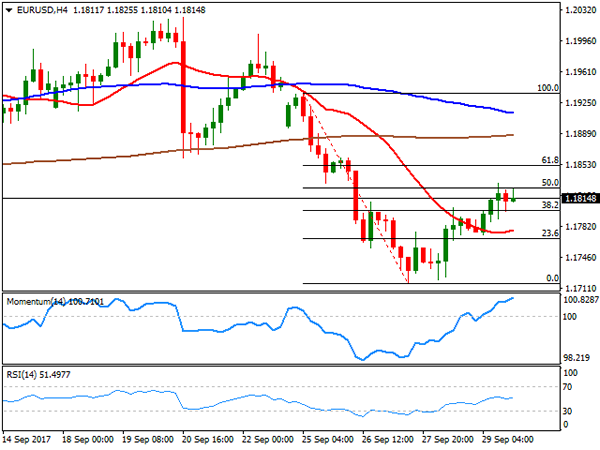
The EUR/USD pair fell for a third consecutive week, ending it a 1.1814 and after trading as low as 1.1716. The common currency took a dive at the beginning of the week as a result of Angela Merkel’s sour victory in the German election, which brought back concerns about rising anti-global populism within the EU. An upward corrective movement that begun on Thursday was fueled on Friday by soft US data, as the Fed’s favorite inflation measure, the core PCE index for August missed market’s expectations. Consumer inflation rose by 0.1% in the month, matching July’s reading, but below forecast of 0.2%, while when compared to a year earlier, it came in at 1.4%, below the expected 1.5%. Also, the University of Michigan’s Index of Consumer Sentiment fell 1.7 points in September to 95.1, on concerns about the economic consequences of the latest hurricanes that hit the US. Limiting EUR’s advance was worst-than-expected inflation in the area, as preliminary September estimate fell to 1.1% YoY from previous 1.3%.
The pair’s decline seems still corrective in the long-term, as it´s down around 300 pips after rising roughly 1500 pretty much straight since bottoming around 1.0600 last April, and despite the latest recovery, it could extend during the upcoming days, as the pair was unable to recover beyond August bottom in the 1.1820/30 price zone. In the daily chart, technical indicators have bounced from near oversold levels, but remain within bearish territory, indicating that selling interest is limited, although the price is well below a bearish 20 SMA, around 1.1920. The pair managed to correct half of its weekly losses, with the 50% retracement of the decline at 1.1825, converging with the mentioned lows. In the 4 hours chart, the pair presents an upward potential yet to be confirmed, as the price recovered above a now flat 20 SMA, the RSI indicator holds directionless around its mid-line, and the Momentum indicator aims north near overbought levels.
Support levels: 1.1765 1.1720 1.1690
Resistance levels: 1.1830 1.1870 1.1920
USD/JPY
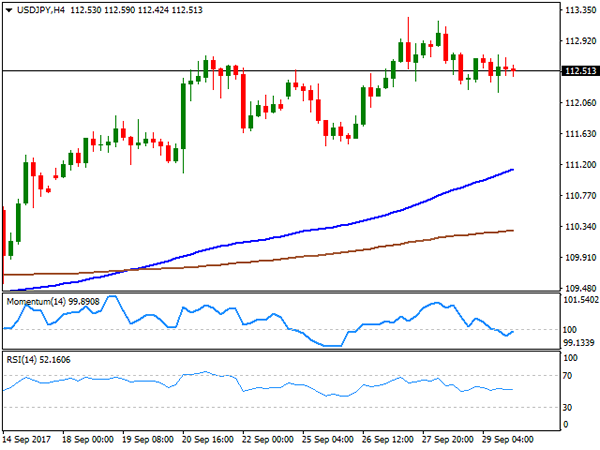
The USD/JPY pair closed the week barely higher at 112.51, undermined on Friday by poor US consumer inflation figures, which limited dollar’s ability to extend its gains against the safe-haven yen. Gains in stocks and higher US Treasury yields, however, kept the Japanese currency under pressure. US treasury yields settled near fresh 11-week highs, with the 10-year note benchmark closing on Friday at 2.33%, while the S&P and the Nasdaq closed at record highs. The macroeconomic week will start with Japan releasing the Tankan manufacturing index survey for Q3, expected to show a modest improvement in activity during this last three months. Technically, the daily chart for the pair shows that it holds on to gains beyond its 100 and 200 DMAs, while technical indicators corrected overbought conditions, to turn flat well above their mid-lines, indicating that, despite the absence of upward momentum, bulls maintain the lead. Shorter term, and according to the 4 hours chart, the lack of directional strength all through the week left technical indicators within neutral territory, but the risk remains towards the upside, as the price held well above a bullish 100 SMA, now around 111.10.
Support levels: 112.20 111.85 111.50
Resistance levels: 112.90 113.25 113.60
GBP/USD
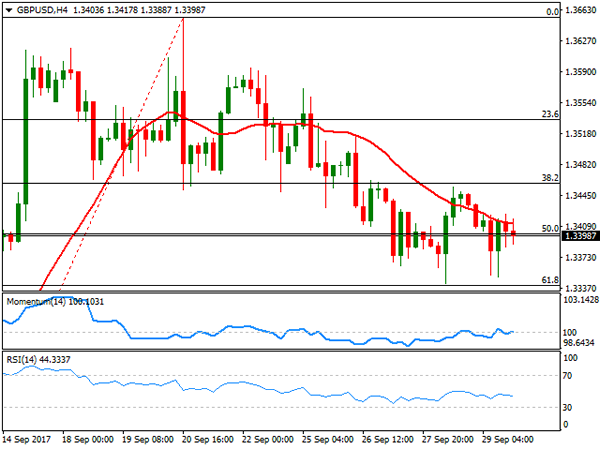
The British Pound remained under pressure this past week, ending it against the greenback at 1.3398, as news coming from the UK on Friday were overall negative. BOE´s Governor Carney said that interest rate hikes in the future will be limited and gradual if they happen, pretty much freezing expectations of a change in the economic policy for this year. Also, UK’s final Q2 GDP remained unchanged at 0.3% for the three months to June, but the year-on-year figure was downwardly revised to 1.5% from an initial estimate of 1.7%. In the meantime, Brexit negotiations are going nowhere: during the weekend EU Junker claimed that there will be no sufficient progress by the end of October "unless miracles would happen." The political uncertainty alongside with an on-hold BOE should limit Pound attempts to regain the upside. From a technical point of view the daily chart shows that the weekly decline stalled at the 61.8% retracement of the latest upward move, at 1.3340, now converging with the 50% retracement of the same rally and a bullish 20 SMA. Technical indicators in the same chart hold above their mid-lines, with the Momentum trying to recover ground, but the RSI maintaining its bearish slope, this last leaning the scale towards the downside. In the 4 hours chart, however, the pair presents a neutral-to-bearish stance, as the pair remained limited below a bearish 20 SMA for most of the week, but technical indicators head nowhere around their mid-lines. A bearish acceleration through the 1.3340 support, should lead to a downward extension towards 1.3250 the next relevant static support.
Support levels: 1.3340 1.3300 1.3250
Resistance levels: 1.3410 1.3460 1.3510
GOLD
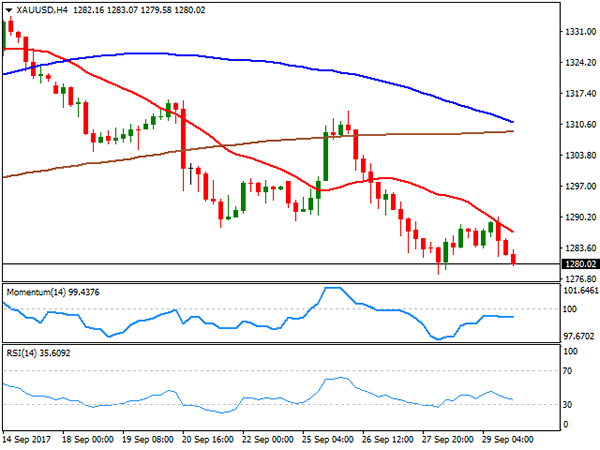
Spot gold ended September at $1,280.02 a troy ounce, as hopes that the Fed will remain in the tightening path, despite sluggish inflation, maintained market’s mood up, with stocks rising to record highs to the detriment of the safe-haven metal. Gold was down roughly 3% in September after hitting at the beginning of the month its highest for this 2017, at 1,357.49, although declines were limited amid geopolitical tensions surging here and there. The negative bias remains firm in place, given that in the daily chart, the price remains well below a bearish 20 DMA, whilst technical indicators remain well into bearish territory, aiming to turn south after a period of consolidation. In the same chart, the 100 DMA stands at 1,274.56, and while directionless, the indicator is a key psychological support, with a break below it probably fueling the negative sentiment towards the metal. Shorter term, and according to the 4 hours chart, the risk is also towards the downside, with the 20 SMA accelerating south above the current level, and the RSI also showing a strong downward slope, currently at 35.
Support levels: 1,274.55 1,267.20 1,256.70
Resistance levels: 1,283.10 1.294.25 1,303.95
WTI CRUDE OIL
West Texas Intermediate crude oil futures closed little changed on Friday at $51.62 a barrel, as an increase in the number of US rigs drilling for oil was offset by concerns over decreasing supplies from the Kurdish region of Iraq. According to Baker Hughes, the number of active rigs drilling for oil increased by 6 this past week to 750, after falling four of the previous five weeks. The commodity holds anyway near the multi-month high reached this past week at $52.84, amid strong compliance from OPEC and non-OPEC producers with the output cut deal signed last November. US crude lost upward momentum during these last couple of days, but the daily chart indicates that the bullish trend persists, as in the daily chart, technical indicators have barely corrected from overbought readings, but the RSI indicator turned horizontal around 66, whilst the price remains far above its 100 and 200 DMAs. Shorter term, and according to the 4 hours chart, the commodity presents a neutral-to-bullish stance, with technical indicators now heading nowhere around their mid-lines, whilst the price remains far above its 100 and 200 SMAs, with the shortest accelerating above the largest.
Support levels: 51.20 50.50 50.00
Resistance levels: 51.90 52.35 52.70

DJIA
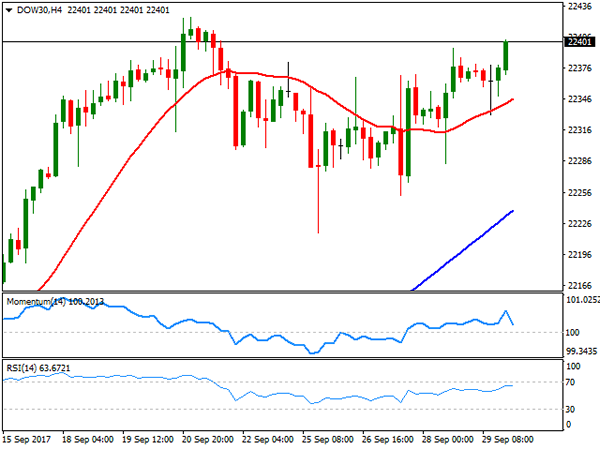
US indexes surged on Friday with the Nasdaq Composite, and the S&P ending at record highs and the Dow Jones Industrial Average not far below its own. This last, added 23 points, to close at 22,405.09 fueled by a hawkish Fed and President Donald Trump’s tax cut proposal . Adding to the positive tone of equities were news that Trump interviewed Fed´s Jerome Powell and Kevin Warsh, as possible candidates to replace Janet Yellen as head of the central bank, both seen as hawkish and more inclined to raise rates. Most members were up within the Dow, with Cisco Systems leading advancers with a 0.84% gain. Nike on the other hand, was the worst performer, down 1.48%, followed by Wal-Mart that lost 1.03%. The daily chart for the DJIA indicates that the bullish tone remains firm in place, with the index near its record high and above all of its moving averages, while technical indicators resumed their advances within positive territory. In the 4 hours chart, the index presents a neutral-to-bullish stance, with the index finding buying interest on approaches to a modestly bullish 20 SMA, but with technical indicators holding directionless above their mid-lines.
Support levels: 22,353 22,318 22,258
Resistance levels: 22,425 22,460 22,500
FTSE100
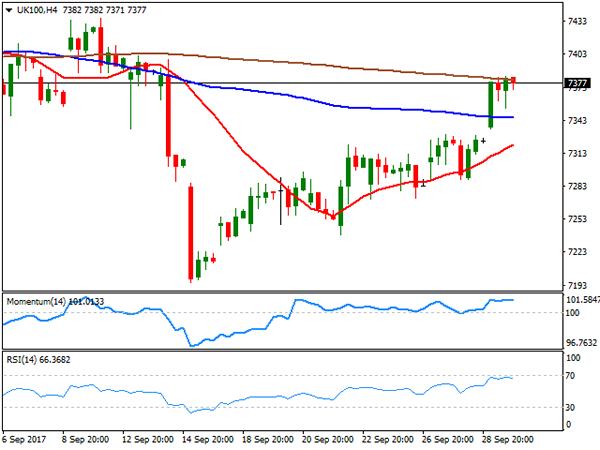
The FTSE 100 gained 50 points on Friday to close at 7,372.76, down for September but off its monthly low. A weaker Pound helped the index recover ground in the last two weeks, while at the end of this past week, worst-than-expected GDP data exacerbated Sterling’s decline. Miners were among the best performers, as despite gold’s decline, most base metals ended the month on a higher note. The best performer was ITV that added 3.56%, followed by Anglo American and Antofagasta that added over 2.0% each. Hargreaves Lansdown led decliners, down 1.14%. The daily chart for the Footsie shows that, while the bearish pressure has eased, the index is still far from entering bullish territory, as it closed below its 100 DMA, while the Momentum indicator remains within negative territory. The index also settled above a still bearish 20 SMA, whilst the RSI aims higher around 54, limiting chances of a steeper decline for the upcoming days. In the 4 hours chart, the index was unable to advance beyond a marginally bearish 200 SMA, but established above a bullish 20 SMA, also above the 100 SMA, while technical indicators consolidate well above their mid-lines supporting additional gains ahead on a break above 7,383, Friday’s high and the immediate resistance.
Support levels : 7,354 7,312 7,282
Resistance levels: 7,383 7,422 7,461
DAX
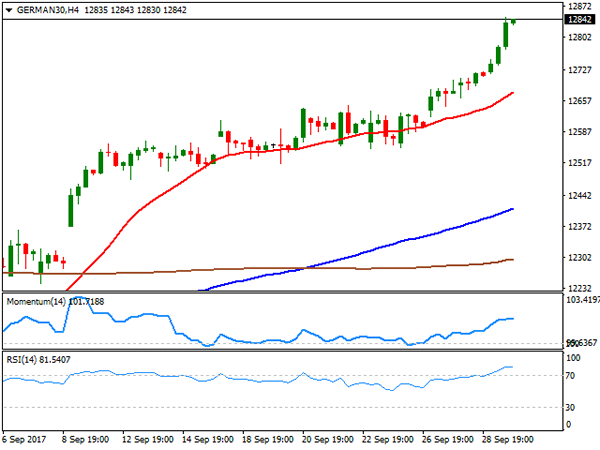
European equities surged on the last trading day of the month, with the German DAX closing at 12,828.86, up 125 points or 0.98%, its highest in three months. A solid macroeconomic recovery in the region, coupled with a cheaper EUR and optimistic markets over US economic and monetary policy future, helped indexes advance sharply this past week. Bayer was the best performer on Friday, up 2.35%, followed by E.ON which added 2.35%, whilst just five members closed down, led by Merck that shed 3.43%. The German benchmark retains its bullish tone heading into the new week according to the daily chart, with the 20 DMA advancing above the 100 DMA, and the RSI indicator heading north within overbought readings, currently at 73. In the shorter term, and according to the 4 hours chart, the risk is also towards the upside, as the index is far above all of its moving averages, whilst technical indicators have barely pared their advances within overbought territory.
Support levels: 12,796 12,752 12,710
Resistance levels: 12,847 12,881 12,933