EUR/USD
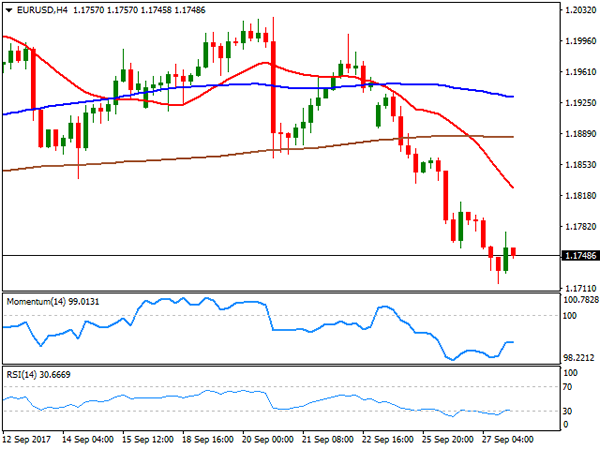
EUR/USD’s decline continued this Wednesday, with the pair falling down to 1.1716 during US trading hours, to recover partially later, on the back of mixed US data. According to official releases, Durable Goods Orders bounced from July’s slump, up in August by 1.7% against market’s expectations of 1.0%, and indicating an acceleration in orders for business equipment at the beginning of the third quarter. Pending home sales, however, fell sharply in the same month with the headline index down 2.6%, and for the fifth time in six months, as slower activity in the areas hit by hurricanes will likely pull existing sales for the year below the pace set in 2016, according to the National Association of Realtors.
The dollar maintained the strong footing set at the beginning of the week, after US Yellen said on Tuesday that, while a gradual approach to hikes is appropriate in the light of subdued inflation, she also added that the Central Bank should be wary of moving too gradually.
Speaking on the tax reform at the end of the US session, US President Trump pledged for making "the tax code simple, and easy to understand," and deliver a "historic tax relief" to the American people. He also talked about the Obamacare bill reform, and trade deals, but his speech was more of a show than an official announcement. The highest note of his speech was the promise to cut corporate rates to 20% from the current 35%-39%, in attempt to attract investors that moved abroad.
The greenback showed little reaction to trumps words, with the EUR/USD pair ending the day at 1.1748. Technically, the pair is still poised to extend its downward move as the intraday attempt to recover ground was contained by selling interest around former support in the 1.1770 region, now the immediate resistance, while in the 4 hours chart, the 20 SMA heads lower almost vertically after crossing below the 100 and 200 SMAs, anyway far above the current level. Also, technical indicators in the mentioned chart have barely corrected extreme oversold conditions before losing upward strength, still deep in negative territory. A break below the mentioned daily low, should result in a test of 1.1661, August monthly low, while beyond this last, the pair could continue falling towards a major long term support at 1.1460.
Support levels: 1.1715 1.1690 1.1660
Resistance levels: 1.1775 1.1810 1.1850
USD/JPY
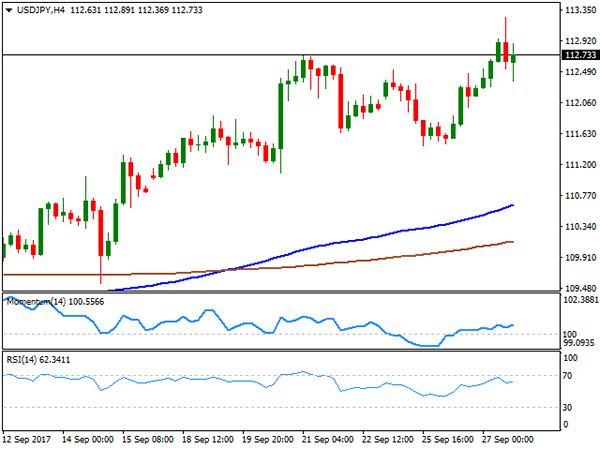
The USD/JPY pair advanced up to 113.25 this Wednesday, its highest since mid July, fueled by a strong advance in US Treasury yields which reached fresh multi-week highs right ahead of Wall Street’s opening and following the release of better-than-expected US Durable Goods Orders for August. A disappointing US housing report for the same month, however, dragged the pair lower afterwards, holding within positive territory at the end of the day anyway. During the upcoming Asian session, BOJ’s Kuroda is set to speak at the National Securities Industry Convention, in Tokyo, but given that the Central Bank has maintained the status quo, seems unlikely he could affect the yen. Equities and yields, therefore, will remain as the main market motors for yen crosses. Up for a second consecutive day, the pair maintains a positive tone short-term, although the upward momentum remains limited, as in the 4 hours chart, the price continues developing well above its 100 and 200 SMAs, while the Momentum indicator aims modestly higher within neutral territory, as the RSI indicator aims to recover ground, but remains below its daily low, currently at 62.
Support levels: 112.30 111.90 111.60
Resistance levels: 112.90 113.25 113.60
GBP/USD
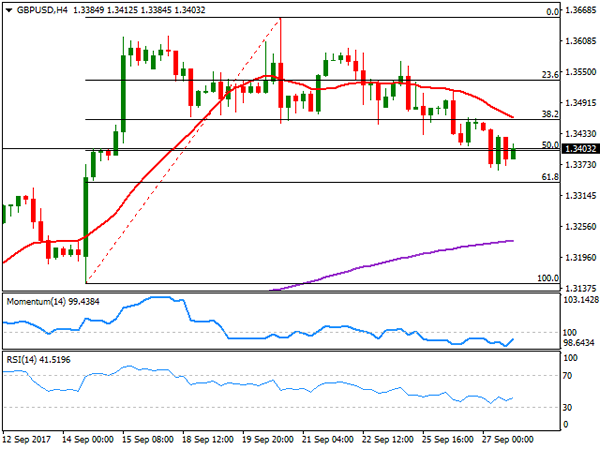
Pound’s decline gained momentum this Wednesday, with the GBP/USD pair down to 1.3363, its lowest since September 14th. The UK released the September CBI retail sales survey of retailers and wholesaler, which revealed that retail sales in the month grew at the fastest pace since September 2015. The index resulted at 42% as 55% of the retailers said that sales volumes were up, whilst 15% said they were down. For this Thursday, the most relevant UK event is a scheduled speech from BOE’s Governor Carney, but he is due to deliver the opening remarks at the Bank of England’s conference celebrating 20 years of independence, in London, so chances of a monetary policy-related comments are limited. Despite strong local sales data, the pair remained under selling pressure, having spent most of the US session stuck around 1.3400. The level stands for the 50% retracement of the latest bullish run between 1.3146 and 1.3653. From a technical point of view, the pair is biased lower, as the 20 SMA in the 4 hours chart gained downward strength above the current level, now near the 38.2% retracement of the mentioned rally around 1.3460 and reinforcing the static resistance, while technical indicators hover within negative territory, lacking directional clues. The main support comes now at 1.3340, the next Fibonacci support and the level to break to confirm additional declines ahead.
Support levels: 1.3340 1.3300 1.3260
Resistance levels: 1.346 1.3510 1.3550
GOLD
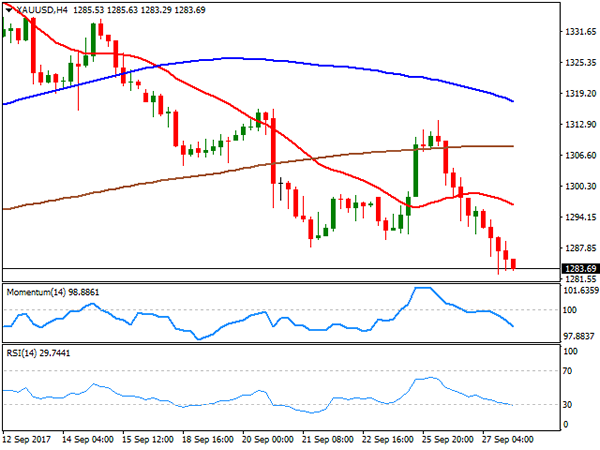
Gold prices continued falling, with spot reaching a fresh September low of $1,282.49 a troy ounce, to settle at 1,283.71 by the end of the US session. The bright metal was hit strongly by a hawkish Fed, and the latest slide seems far from over, now that the commodity sits comfortably below the 1,300.00 threshold. From a technical perspective, the downward momentum persists in the daily chart, with technical indicators resuming their slides and particularly the RSI that heads strongly south at 39 a fresh 2-month low. The 100 DMA is now a probable bearish target, at 1,274.50. Shorter term, and according to the 4 hours chart, the metal is also biased lower, as the price settled well below all of its moving averages, with the 20 SMA gaining downward strength around 1,296.30, and technical indicators also heading sharply lower within bearish territory, and nearing oversold levels, with no signs of changing course.
Support levels: 1,288.10 1,280.45 1,272.20
Resistance levels: 1,303.95 1,311.60 1,321.45
WTI CRUDE OIL
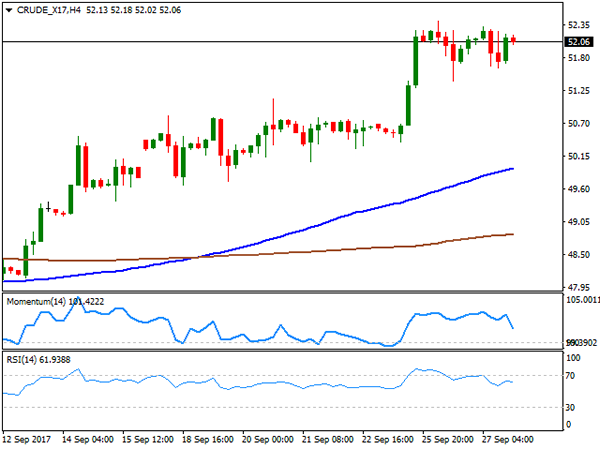
Crude oil prices were little changed for a second consecutive day, as despite the EIA report showed that US crude supplies fell by 1.84M in the week ended September 22nd, much better than the 2.29M build expected, gasoline stockpiles rose by more than expected. Gasoline stockpiles were up by 1.1 million barrels, after falling in the previous three weeks. The decline in crude stockpiles was due to refinery runs and exports being up last week, according to the official report. West Texas Intermediate crude oil futures ended at $52.06 a barrel, and the daily chart shows that the index remains well above its 100 and 200 SMAs, while technical indicators have lost upward strength, turning marginally lower, but still within overbought readings. Shorter term, and according to the 4 hours chart, technical indicators keep retreating within bullish territory, but the price remains far above its 100 and 200 SMAs. The commodity is having a hard time extending gains beyond the 52.00 level, as advances beyond it have been limited, and quickly reverted ever since mid 2015. The risk of a downward move, however, remains limited in the short term, amid hopes of a rebalancing oil market.
Support levels: 51.20 50.50 49.80
Resistance levels: 52.45 53.10 53.70
DJIA
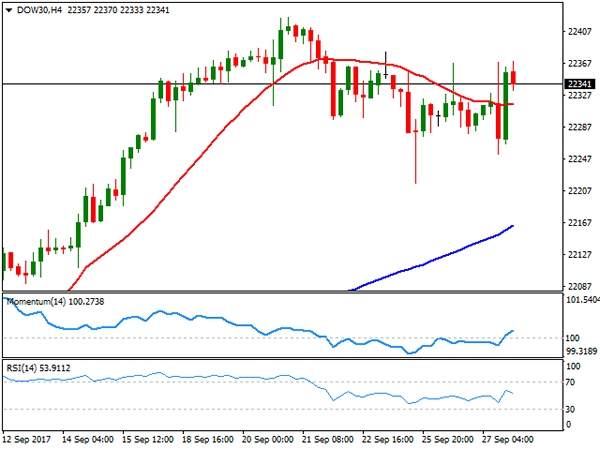
Hopes for a US tax reform pushed US indexes into the green this Wednesday, with the Dow Jones Industrial Average adding 56 points, to end at 22,340.71. The Nasdaq Composite added 1.15%, to 6,453.26, backed by a rally in tech stocks, while the S&P closed at 2,597.04, 10 points higher on the day. US President Trump presented the tax reform in Indiana by the end of the US session, but the speech was leaked ahead of the event, triggering little action at the end of the day. Nevertheless, the financial sector was the best performer on the news, and within the Dow, the best performer was United Technologies, which added 2.13%, followed by Goldman Sachs that closed 2.07% higher. JP Morgan Chase comes next, with a 1.63% gain. General Electric, on the other hand, led decliners, down by 2.23%. The Dow trimmed its previous days’ losses, flat for the week and up for the day. Technically, the daily chart shows that the 20 DMA maintains a strong upward momentum below the current level, while the RSI indicator resumed its advance currently at 65. The Momentum indicator lags, heading south, but well above its mid-line overall maintaining the positive bias. Shorter term, and according to the 4 hours chart, the index presents a neutral-to-bullish stance, having settled a few points above a flat 20 SMA, and with technical indicators aim higher above their mid-lines.
Support levels: 22,318 22,258 22,216
Resistance levels: 22,370 22,424 22,460
FTSE100
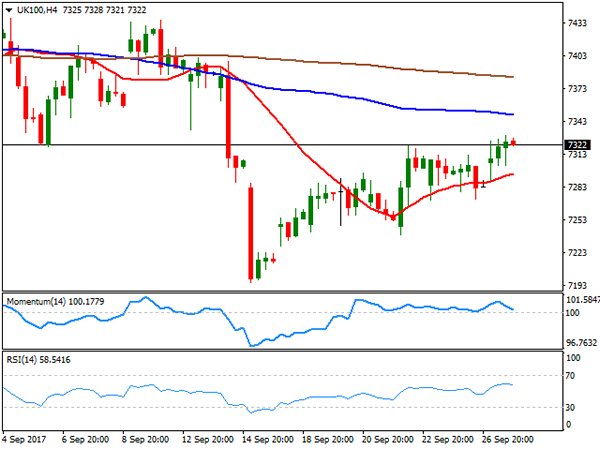
The FTSE 100 gained 27 points on Wednesday, to end the day at 7,313.51, its highest settlement in two-weeks, helped by persistent Pound weakness, and a rally in financial-related equities. Also, news that publisher Pearson’s recovery strategy got a positive note from Exane BNP Paribas, led it to the first place, as the share added 3.86%, followed by Royal Bank of Scotland that added 3.44%. Leading decliners, on the other hand, was Randgold Resources, down 2.34%, as gold prices extended their declines on broad dollar’s strength. Footsie’s recovery is still not enough to take the index out of a bearish market, as technical readings in the daily chart keep favoring the downside, given that the index remains below a bearish 20 DMA, whilst technical indicators keep consolidating within negative territory. In the 4 hours chart, the index remained above a marginally bullish 20 SMA, but below the larger ones, while technical indicators have turned lower within positive territory, overall neutral.
Support levels : 7,287 7,236 7,195
Resistance levels: 7,344 7,381 7,422
DAX
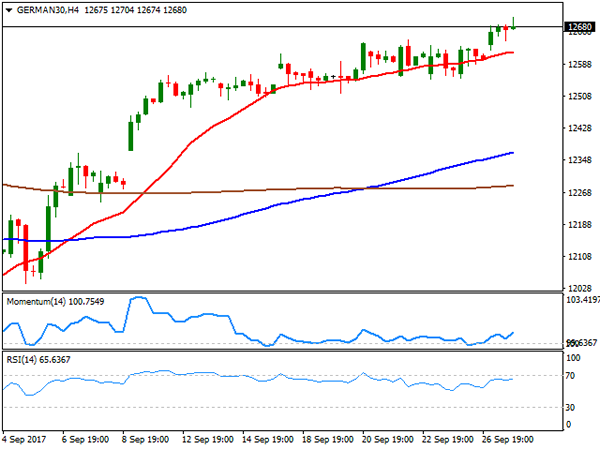
European equities closed in the green, helped by a recovery in financials, resulting in the German DAX ending the day at 12,657.41, up 52 points. Ahead of US Trump’s speech, financial related equities advanced on hopes of fiscal stimulus in the US, in the form of tax cuts. Within the DAX, Deutsche Bank and Commerzbank where the best performers, up 3.47% and 2.38% respectively. Only eight members closed down, led by Vonovia that shed 1.08%. The index surpassed by a few points July’s high of 12,677, further advancing in after-hours trading, following the lead of Wall Street. From a technical point of view, the daily chart indicates that the index could extend its advance, as technical indicators resumed their advances within positive territory, whilst the 20 DMA is about to surpass the 100 DMA. In the 4 hours chart, the index maintains a neutral-to-bullish bias, as the index holds firmly above an anyway horizontal 20 SMA, while the Momentum indicator aims barely higher above its mid-line, and the RSI indicator consolidates around 65.
Support levels: 12,686 12,642 12,596
Resistance levels: 12,704 12,732 12,774