
A note on lower timeframe confirming price action…
Waiting for lower timeframe confirmation is our main tool to confirm strength within higher timeframe zones, and has really been the key to our trading success. It takes a little time to understand the subtle nuances, however, as each trade is never the same, but once you master the rhythm so to speak, you will be saved from countless unnecessary losing trades. The following is a list of what we look for:
- A break/retest of supply or demand dependent on which way you’re trading.
- A trendline break/retest.
- Buying/selling tails … essentially we look for a cluster of very obvious spikes off of lower timeframe support and resistance levels within the higher timeframe zone.
- Candlestick patterns. We tend to only stick with pin bars and engulfing bars as these have proven to be the most effective.
We typically search for lower-timeframe confirmation between the M15 and H1 timeframes, since most of our higher-timeframe areas begin with the H4. Stops are usually placed 1-3 pips beyond confirming structures.
EUR/USD
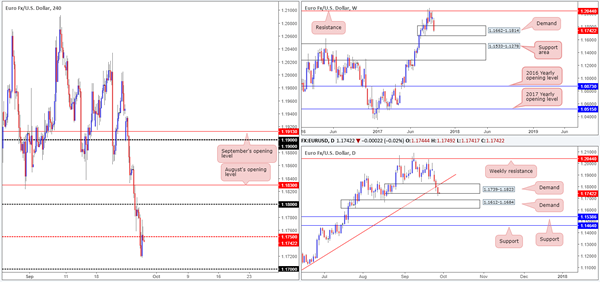
The single currency sustained further losses on Wednesday, consequently forcing price through the H4 mid-level support at 1.1750 and on to a session low of 1.1717. As of current price, the H4 candles have established resistance around the underside of 1.1750 and may look to approach the 1.17 handle today, followed closely by a Quasimodo support registered at 1.1681 (not seen on the screen).
Sweeping over to the weekly timeframe, we can see that recent selling has brought the unit deep into demand planted at 1.1662-1.1814. Meanwhile, down on the daily timeframe price concluded yesterday’s segment marginally breaching demand pegged at 1.1739-1.1823. By and of itself, this move has likely filled a truckload of stop-loss orders and potentially cleared the pathway south down to another demand penciled in at 1.1612-1.1684.
Suggestions: In view of the above notes, we have our eye on the H4 Quasimodo support level mentioned above at 1.1681 for longs today. Here’s why:
Stop-loss orders below the 1.17 handle will help provide liquidity for bigger traders to buy.
The H4 Quasimodo aligns beautifully with the top edge of oncoming daily demand at 1.1684.
The H4 level is also seen lurking within the lower limits of the aforesaid weekly demand.
The desk has a placed a pending buy order at 1.1681 with a stop positioned below the lower edge of the said weekly demand at 1.1660.
Data points to consider: German Prelim CPI m/m; Spanish Flash CPI y/y at 8am. US GDP q/q and US Unemployment claims at 1.30pm, followed by FOMC member Fischer speaking at 3.15pm GMT+1.
Levels to watch/live orders:
- Buys: 1.1681 ([pending order] stop loss: 1.1660).
- Sells: Flat (stop loss: N/A).
GBP/USD
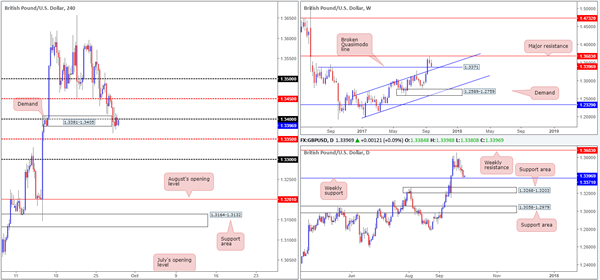
For those who read Wednesday’s report on the British pound you may recall our desk highlighting the possibility of a fakeout being seen through H4 demand at 1.3381-1.3405/1.34 handle. Our rationale behind this move was due to a weekly broken Quasimodo line seen lurking just below the noted demand at 1.3371/channel resistance-turned support extended from the high 1.2706. The stop-loss orders plotted below the current H4 demand, as far as we’re aware, will help provide liquidity for the bigger traders to get involved.
As you can see, on this occasion our analysis proved to be correct. With that said, the bulls are struggling to muster enough strength to break above 1.34 at the moment. Should 1.34 give way, which we believe it eventually will, we feel a strong push up to at least the H4 mid-level resistance at 1.3450/1.35 handle will be seen.
Suggestions: Wait for H4 price to close above 1.34. From this point, one could either buy at market (effectively buying the breakout), or conservatively wait to see if price retests 1.34 as support and buy with lower-timeframe confirmation (see the top of this report).
Data points to consider: BoE Gov. Carney speaks at 9.15am. US GDP q/q and US Unemployment claims at 1.30pm, followed by FOMC member Fischer speaking at 3.15pm GMT+1.
Levels to watch/live orders:
- Buys: A H4 close above 1.34 is, in our technical view, a strong indication that the unit wants 1.3450/1.35.
- Sells: Flat (stop loss: N/A).
AUD/USD
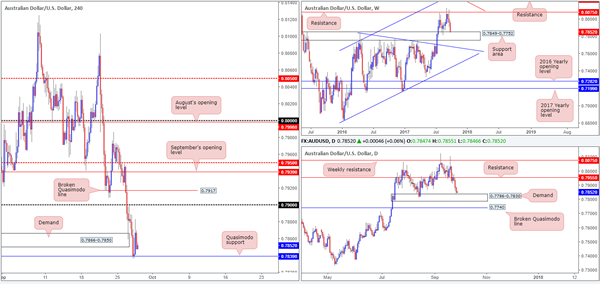
In Wednesday’s analysis, our team’s focus was primarily on a potential fakeout being seen below H4 demand at 0.7866-0.7850 into a H4 Quasimodo support level at 0.7839. On this occasion, our analysis proved to be correct.
Not only did 0.7839 align nicely with the top edge of daily demand at 0.7838 and nearby the top edge of the weekly support area at 0.7849, there were also likely a huge amount of stop-loss orders planted below the current H4 demand. Remember, when a buyer’s stop is triggered it becomes a sell order, which is ideal liquidity to buy!
Our pending buy order at 0.7839 was filled and price rallied to a high of 0.7882. By this point, considering the stop-loss order was positioned at 0.7805, we had more than one times our risk in profits so we reduced risk to breakeven. And just as we did that, the unit began to turn red! Should we have taken partial profits when we had the chance? Maybe! However, our plan was, and still is, to wait for price to tap 0.79 before taking profits.
Suggestions: Despite price trading near our breakeven point, we still believe that this market is headed higher. Therefore, we’ll continue to hold our current position and see how price action unfolds going into London.
Data points to consider: RBA Assist Gov. Debelle speaks at 10am. US GDP q/q and US Unemployment claims at 1.30pm, followed by FOMC member Fischer speaking at 3.15pm GMT+1.
Levels to watch/live orders:
- Buys: 0.7839 ([live] stop loss: breakeven).
- Sells: Flat (stop loss: N/A).
USD/JPY
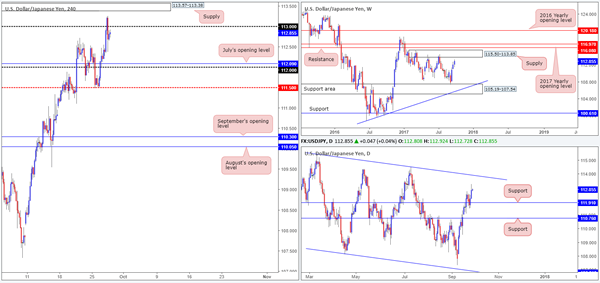
Sizing up the weekly timeframe this morning, we can clearly see price is currently heading for a supply zone coming in at 115.50-113.85. This area, as you can see, has held price lower on two previous occasions so there’s a fair chance that we may see history repeat itself here! In conjunction with weekly flow, daily action is also seen holding ground at support drawn from 111.91. Should price continue to push higher from here, the next upside target is seen at a channel resistance extended from the high 115.50, which happens to intersect with the noted weekly supply.
Across on the H4 timeframe, price strongly broke above the 113 handle going into the early hours of US trading on Wednesday. With the piece failing to generate much follow-through action above this number, the pair ended the day closing back below the 113 vicinity.
Suggestions: Neither a long nor short seems attractive at this time. A long at current price may be in-line with higher-timeframe direction, but given the 113 handle and nearby H4 supply at 113.57-113.38, we will pass. As for selling, we will not look to become sellers in this market until we see H4 price tap the 114 handle. At this point, price will be trading within the aforesaid weekly supply and also around the daily channel resistance.
Data points to consider: BoJ Gov. Kuroda speaks at 7.35am. US GDP q/q and US Unemployment claims at 1.30pm, followed by FOMC member Fischer speaking at 3.15pm GMT+1.
Levels to watch/live orders:
- Buys: Flat (stop loss: N/A).
- Sells: 114 region.
USD/CAD
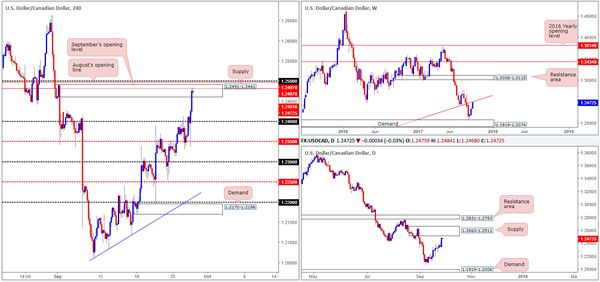
The USD/CAD, as you can see, aggressively pushed to the upside on Wednesday following BoC’s Gov. Poloz’s comments regarding a cautious stance after raising rates twice this year. The impact saw the 1.24 handle taken out and H4 price drive into the walls of a supply zone at 1.2491-1.2461. Not only is this a nice-looking supply zone, it is also surrounded by both September/August’s opening levels at 1.2497/1.2481/the 1.25 handle and is positioned nearby a weekly trendline resistance extended from the low 0.9633/daily supply at 1.2663-1.2511.
Suggestions: Seeing as how H4 price could potentially fake above the current H4 structures to tap the higher-timeframe areas, the team is wary of shorting at market. In light of this, we would advise waiting for a reasonably sized H4 bear candle to take shape from here (preferably a full, or near-full-bodied candle), before pulling the trigger.
Data points to consider: US GDP q/q and US Unemployment claims at 1.30pm, followed by FOMC member Fischer speaking at 3.15pm GMT+1.
Levels to watch/live orders:
- Buys: Flat (stop loss: N/A).
- Sells: 1.2491-1.2461 area ([waiting for a reasonably sized H4 bearish candle to form – preferably a full, or near-full-bodied candle – is advised] stop loss: ideally beyond the candle’s wick).
USD/CHF
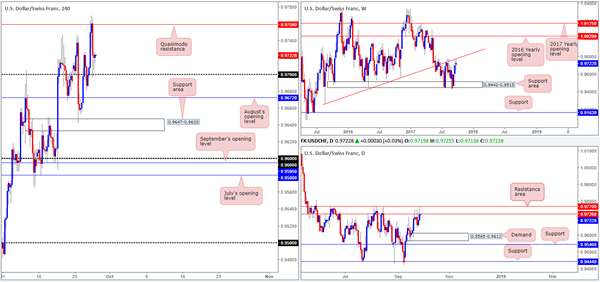
In Wednesday’s report, we stated that instead of looking to long the market above 0.97, a better approach might have been to wait and sell the H4 Quasimodo resistance line at 0.9759. Our rationale behind this approach stemmed from higher-timeframe structure. Weekly price, at the time, was trading within striking distance of a trendline resistance extended from the low 0.9257. Alongside this, we also saw that daily price was trading from a resistance area pegged at 0.9770/0.9726 and showed room to decline down to at least demand located at 0.9565-0.9611.
As you can see, price did exactly as expected. Well done to any of our readers who took shorts from 0.9759! Even if you closed out the full position at 0.97, you’d have netted good returns. Not bad for a few hours work!
Suggestions: Apart from our short call on Wednesday, we do not see much else to hang our hat on at the moment. A break below 0.97, although both the weekly and daily timeframes indicate further selling could be on the cards, is unfortunately a challenging sell. This is because of August’s opening level plotted just below at 0.9672, followed closely by a H4 support area at 0.9647-0.9633.
Data points to consider: US GDP q/q and US Unemployment claims at 1.30pm, followed by FOMC member Fischer speaking at 3.15pm GMT+1.
Levels to watch/live orders:
- Buys: Flat (stop loss: N/A).
- Sells: Flat (stop loss: N/A).
DOW 30
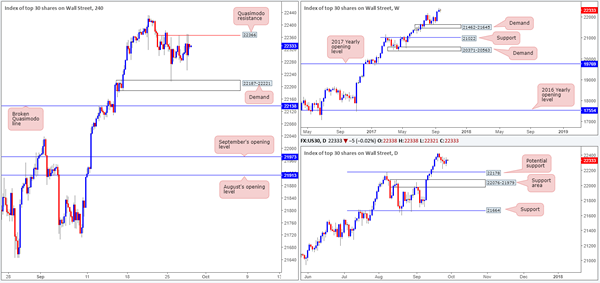
Despite the solid bounce seen from H4 demand at 22187-22221, the index is seen struggling to trade beyond the minor H4 Quasimodo resistance line at 22366. In spite of this, the technicals over on the daily timeframe printed a bullish engulfing candle yesterday which could, given the underlying trend, be a strong indication that US equities may be ready to push higher.
Suggestions: The key thing to remember here is this market remains entrenched within a strong uptrend, and is trading from record highs as we write. Therefore, a decisive H4 push above the aforesaid H4 Quasimodo resistance would, for us at least, be a cue to begin looking to buy. However, before pulling the trigger, a retest, followed by a reasonably strong H4 bull candle in the shape of a full or near-full-bodied candle, would need to be seen.
Data points to consider: US GDP q/q and US Unemployment claims at 1.30pm, followed by FOMC member Fischer speaking at 3.15pm GMT+1.
Levels to watch/live orders:
- Buys: Watch for H4 price to close beyond 22366 and then look to trade any retest seen thereafter ([waiting for a H4 bullish rotation candle to form following the retest is advised] stop loss: ideally beyond the candle’s tail).
- Sells: Flat (stop loss: N/A).
GOLD:
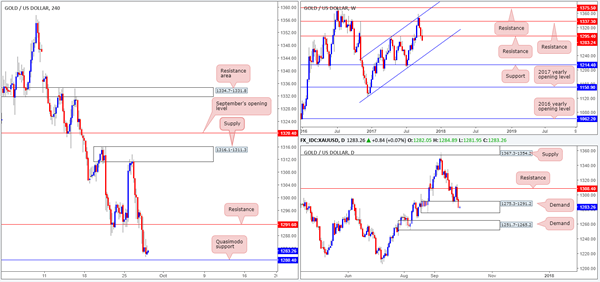
The yellow metal extended losses on Wednesday, forcing H4 price to consume bids around support at 1291.6 and clock a low of 1281.2 on the day. What this move also did was push weekly price further below resistance at 1295.4, further confirming downside to the channel support extended from the low 1282.1. Meanwhile, the daily candles, despite the recent downside move, remains within the walls of demand pegged at 1275.3-1291.2. A violation of this zone would likely lead to gold challenging demand plotted below at 1251.7-1265.2.
Suggestions: While weekly action indicates further selling may be upon us, it would just be too much of a risk shorting into both the current daily demand and nearby H4 Quasimodo support at 1280.4. Likewise, a long, although daily/H4 structure is in play, would be a chancy move as you’d effectively be buying into potential weekly flow!
Therefore, at least for the time being, the desk will remain flat.
Levels to watch/live orders:
- Buys: Flat (stop loss: N/A).
- Sells: Flat (stop loss: N/A).