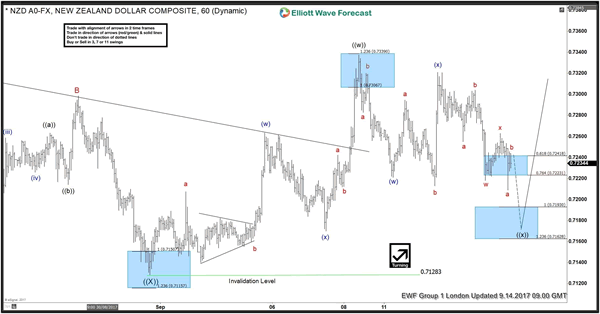
NZDUSD Elliott Wave 1 Hour Chart 09.14.2017
Back then we were pointing out that NZDUSD has ended cycle from the 07/27 peak at 0.7128 low. Consequently we’re expecting larger bounce to happen. NZDUSD is currently short term pull back agianst the 0.7128 low in wave ((x)) black.Proposed pull back is showing incomplete structure, suggesting another marginal push lower toward 0.7193-0.71628 area, where buyers will be waiting for further rally ideally.
Although we expected the rally, we didn’t force trades at that stage because the price structure didn’t have incomplete bullish sequences that will justify the risk.
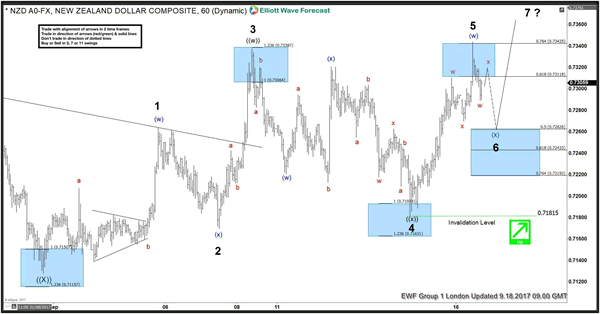
NZDUSD Elliott Wave 1 Hour Chart 09.18.2017
Shortlly after, the price has reached proposed technical area at 0.7193-0.71628 . NZDUSD has found buyers there and we got the nice rally. A few days after, the price has broken above 09/08 peak, making incomplete bullish sequences in the cycle from the 0.71283 low. As we can see at the chart below, we have now 5 swings to the upside, when currently doing 6th swing. As far as pivot at 0.7181 low remians intact we expect the pair to find the buyers for further rally in 7th swing. Due to incomplete bullish sequences, we recommended members to buy the intraday dips in 3,7,11 swings against the 0.71815 low. Until pull back gives us clear 3 wave structure, we have 50-61.8 fibonacci retracement area as a potential buying zone : 0.7262-0.7243.
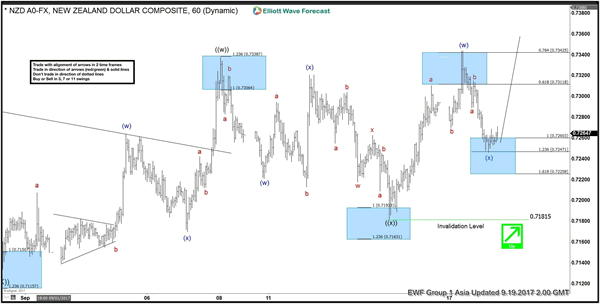
NZDUSD Elliott Wave 1 Hour Chart 09.19.2017
We got proposed pull back (x) and it has reached 50 fibonacci level as expected. It has unfolded as a clear 3 wave abc pattern, when buying area was at 0.7260-0.7247. It’s already giving us reaction from there. We would like to see more separation from the current short term low, to get confimration that (x) blue has ended. We expect the pair to trade higher and like staying long, targeting 0.73921-0.74417 area.
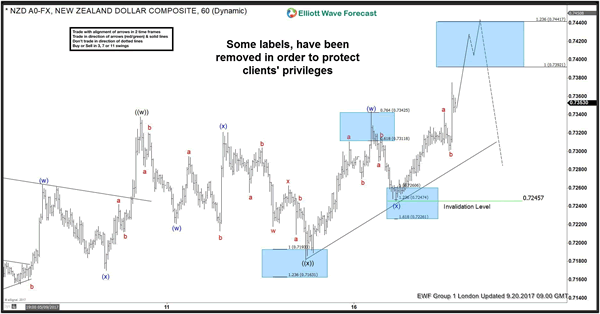
NZDUSD Elliott Wave 1 Hour Chart 09.20.2017
The pair is trading higher as expected, and members are enjoying profits in risk free trades. Next important technical area to the upside comes at 0.73921-0.74417 and it’s expected to be reached before cycle from the 0.7128 low completes as 7 swings structure. Mentioned area should find sellers , and we expect to see larger pull back from those levels.
We advised members to take profits there.