
A note on lower timeframe confirming price action…
Waiting for lower timeframe confirmation is our main tool to confirm strength within higher timeframe zones, and has really been the key to our trading success. It takes a little time to understand the subtle nuances, however, as each trade is never the same, but once you master the rhythm so to speak, you will be saved from countless unnecessary losing trades. The following is a list of what we look for:
- A break/retest of supply or demand dependent on which way you’re trading.
- A trendline break/retest.
- Buying/selling tails … essentially we look for a cluster of very obvious spikes off of lower timeframe support and resistance levels within the higher timeframe zone.
- Candlestick patterns. We tend to only stick with pin bars and engulfing bars as these have proven to be the most effective.
We typically search for lower-timeframe confirmation between the M15 and H1 timeframes, since most of our higher-timeframe areas begin with the H4. Stops are usually placed 1-3 pips beyond confirming structures.
EUR/USD
Weekly gain/loss: + 7 pips
Weekly closing price: 1.1947
In recent news, Angela Merkel is set to secure her fourth term as German Chancellor after tight win over their nearest rival: the Social Democrats and their candidate Martin Schulz.
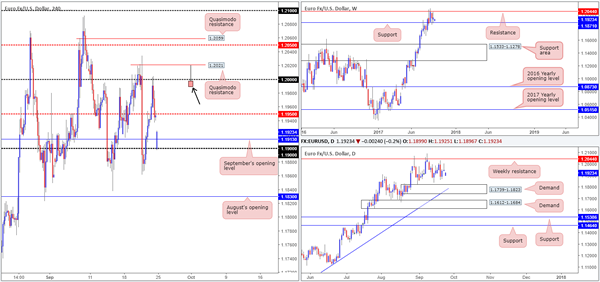
The single currency, as you can see, opened under pressure this morning. Despite the chips falling this way, a floor of support can be seen forming from the 1.19 neighborhood. As the bulls look to reassert their dominance from here, it is likely H4 price will look to immediately fill the weekend gap, bringing the major back up to the mid-level resistance 1.1950.
The story over on the bigger picture remains unchanged. On the whole, the EUR is still entrenched within a strong uptrend, but is currently seen sandwiched between weekly resistance planted at 1.2044 and weekly support at 1.1871/nearby daily demand at 1.1739-1.1823.
Suggestions: Near-term, the weekend gap will likely be filled, with resistance potentially forming from 1.1950.
Assuming 1.1950 is consumed today, the unit will likely gravitate north to reconnect with the large psychological band 1.20. For those considering shorts from 1.20, be prepared for the possibility of a fakeout. Directly above sits a H4 Quasimodo resistance at 1.2021, shadowed closely by weekly resistance at 1.2044. Both levels, in our opinion, are ideal candidates to help facilitate a fakeout above 1.20.
Instead of placing sell orders at 1.20, we will be looking for evidence that a fakeout has taken place before pulling the sell trigger. An ideal scenario would be for H4 price to print a bearish selling wick (as drawn on the chart) that pierces through 1.20, taps the noted H4 Quasimodo and closes lower. Should this trade come to fruition, stops are to be placed above the fakeout candle’s wick and the initial take-profit level would be 1.1950.
Data points to consider: German IFO business climate at 9am; ECB President Draghi speaks at 2am. Several FOMC members take to the stage today at 1.30pm, 5.40pm and 11.40pm GMT+1.
Levels to watch/live orders:
- Buys: Flat (stop loss: N/A).
- Sells: 1.20 region ([waiting for a fakeout of this number is advised before selling] stop loss: ideally beyond the fakeout candle’s wick).
GBP/USD:
Weekly gain/loss: – 92 pips
Weekly closing price: 1.3491
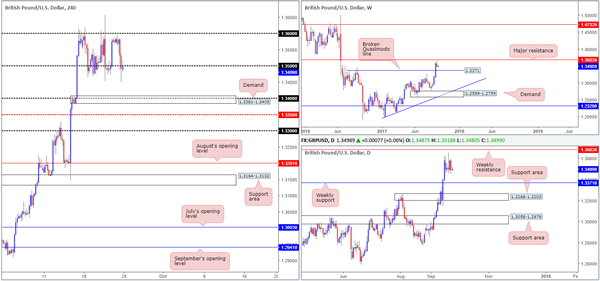
On Friday, the British pound took a hit to the mid-section amid the Theresa May’s speech in Italy. The day ended with the H4 candles breaching and eventually closing beyond the 1.35 handle. Should the bears remain in the driving seat today, the next downside target on tap can be seen at demand drawn from 1.3381-1.3405, which happens to intersect with the 1.34 handle and is shadowed closely by the weekly broken Quasimodo line at 1.3371.
Suggestions: Put simply, with USDX weekly sellers trading from resistance at 11854, and GBP weekly chart showing room to advance as far as resistance at 1.3683, we may see buyers make an appearance this week. For now, however, the desk is going to continue watching H4 price action around the 1.35 boundary. Should a full, or near-full-bodied bearish candle take shape beneath here, a short could be an option down to 1.34ish.
Data points to consider: Several FOMC members take to the stage today at 1.30pm, 5.40pm and 11.40pm GMT+1.
Levels to watch/live orders:
- Buys: Flat (stop loss: N/A).
- Sells: Watch for H4 price to form a full, or near-full-bodied bearish candle below 1.35 for a sell (stop loss: ideally beyond the candle’s wick).
AUD/USD:
Weekly gain/loss: – 44 pips
Weekly closing price: 0.7955
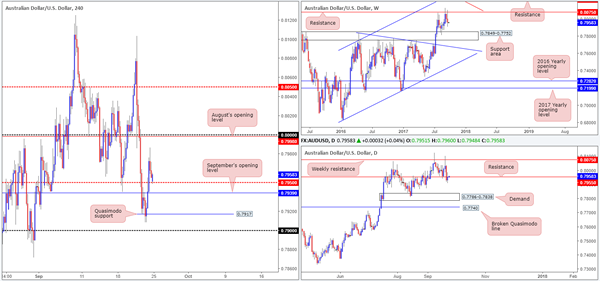
Sweeping over the weekly timeframe this morning we can see that the commodity currency extended losses last week, consequently bringing the unit ever closer to a support area carved from 0.7849-0.7752. In conjunction with the weekly timeframe, daily support at 0.7955 was taken out on Thursday and retested as resistance on Friday. Assuming that the bears hold their ground here, daily demand at 0.7786-0.7838 is likely going to be the next port of call (seen plotted within the walls of the noted weekly support area).
Across on the H4 timeframe, nevertheless, the mid-level support at 0.7950 has just been brought into play. Beneath this level, we have nearby support formed from September’s opening level at 0.7939, followed closely by a Quasimodo support at 0.7917 and the 0.79 handle.
Suggestions: Although both weekly and daily charts indicate further selling may be on the cards, shorting H4 price is a minefield due to the number of supports in view right now. For this reason, our desk will refrain from taking any short positions at this time.
Data points to consider: RBA Assist Gov. Bullock speaks at 10.15pm. Several FOMC members take to the stage today at 1.30pm, 5.40pm and 11.40pm GMT+1.
Levels to watch/live orders:
- Buys: Flat (stop loss: N/A).
- Sells: Watch for H4 price to form a full, or near-full-bodied bearish candle below 1.35 for a sell (stop loss: ideally beyond the candle’s wick).
AUD/USD:
Weekly gain/loss: – 44 pips
Weekly closing price: 0.7955
Sweeping over the weekly timeframe this morning we can see that the commodity currency extended losses last week, consequently bringing the unit ever closer to a support area carved from 0.7849-0.7752. In conjunction with the weekly timeframe, daily support at 0.7955 was taken out on Thursday and retested as resistance on Friday. Assuming that the bears hold their ground here, daily demand at 0.7786-0.7838 is likely going to be the next port of call (seen plotted within the walls of the noted weekly support area).
Across on the H4 timeframe, nevertheless, the mid-level support at 0.7950 has just been brought into play. Beneath this level, we have nearby support formed from September’s opening level at 0.7939, followed closely by a Quasimodo support at 0.7917 and the 0.79 handle.
Suggestions: Although both weekly and daily charts indicate further selling may be on the cards, shorting H4 price is a minefield due to the number of supports in view right now. For this reason, our desk will refrain from taking any short positions at this time.
Data points to consider: RBA Assist Gov. Bullock speaks at 10.15pm. Several FOMC members take to the stage today at 1.30pm, 5.40pm and 11.40pm GMT+1.
Levels to watch/live orders:
- Buys: Flat (stop loss: N/A).
- Sells: Watch for H4 price to form a full, or near-full-bodied bearish candle below 1.35 for a sell (stop loss: ideally beyond the candle’s wick).
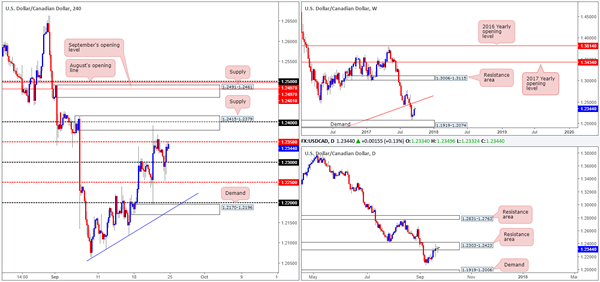
AUD/USD:
Weekly gain/loss: – 44 pips
Weekly closing price: 0.7955
Sweeping over the weekly timeframe this morning we can see that the commodity currency extended losses last week, consequently bringing the unit ever closer to a support area carved from 0.7849-0.7752. In conjunction with the weekly timeframe, daily support at 0.7955 was taken out on Thursday and retested as resistance on Friday. Assuming that the bears hold their ground here, daily demand at 0.7786-0.7838 is likely going to be the next port of call (seen plotted within the walls of the noted weekly support area).
Across on the H4 timeframe, nevertheless, the mid-level support at 0.7950 has just been brought into play. Beneath this level, we have nearby support formed from September’s opening level at 0.7939, followed closely by a Quasimodo support at 0.7917 and the 0.79 handle.
Suggestions: Although both weekly and daily charts indicate further selling may be on the cards, shorting H4 price is a minefield due to the number of supports in view right now. For this reason, our desk will refrain from taking any short positions at this time.
Data points to consider: RBA Assist Gov. Bullock speaks at 10.15pm. Several FOMC members take to the stage today at 1.30pm, 5.40pm and 11.40pm GMT+1.
Levels to watch/live orders:
- Buys: Flat (stop loss: N/A).
- Sells: 1.2491-1.2461 area ([waiting for a reasonably sized H4 bearish candle to form – preferably a full, or near-full-bodied candle – is advised] stop loss: ideally beyond the candle’s wick).
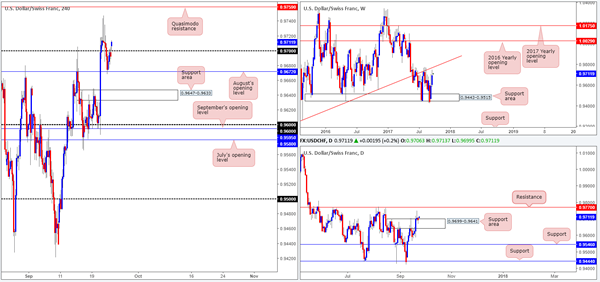
USD/CHF:
Weekly gain/loss: + 102 pips
Weekly closing price: 0.9692
Scanning the weekly timeframe this morning, the unit is seen closing in on the trendline resistance taken from the low 0.9257. Alongside this, we can also see that daily price recently closed above supply at 0.9699-0.9641, and is now being retested as a support area (demand). Providing that the bulls hold firm here, the next resistance can be seen at 0.9770, which happens to intersect with the noted weekly trendline resistance.
The Swissy opened steady this morning, gapping a minor 15 pips higher. This has, as you can see, placed H4 price above the 0.97 handle and potentially opened up the path north to a Quasimodo resistance line coming in at 0.9759.
Suggestions: Instead of trying to long the market above 0.97 when the unit is so close to testing weekly/daily structures, you could simply wait for price to challenge the noted H4 Quasimodo resistance and look to sell. Positioned just 10 pips beneath daily resistance at 0.9770 and intersecting with a weekly trendline resistance this H4 level is, in our opinion, enough to warrant a sell without the need for additional confirmation.
Data points to consider: Several FOMC members take to the stage today at 1.30pm, 5.40pm and 11.40pm GMT+1.
Levels to watch/live orders:
- Buys: Flat (stop loss: N/A).
- Sells: 0.9759 area (stop loss: 0.9776).
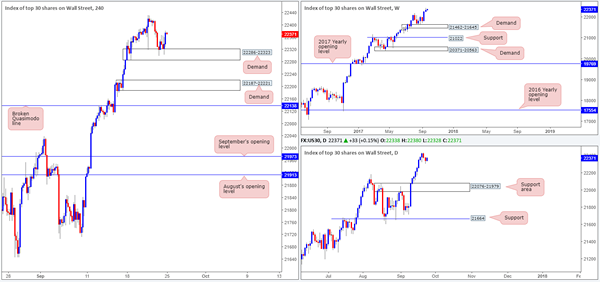
DOW 30:
Weekly gain/loss: + 82 pips
Weekly closing price: 22338
For those who read Friday’s report you may recall us highlighting the H4 demand zone at 22286-22323 as a potential buy zone. As you can see, H4 price printed a nice-looking near-full-bodied bull candle in early London on Friday from this area, which was, in our view, considered a strong buy signal. Alongside H4 price action, the other key thing to note is this market remains entrenched within a strong uptrend, and is trading from record highs as we write i.e. there is absolutely no resistance seen on the horizon!
Suggestions: With the above points in mind, our team is currently long from 22347 with a stop-loss order sited below the demand zone at 22279.
In the hope of joining the long-term trend, we intend on holding this position for now and will only look to reduce risk to breakeven once/if price achieves fresh highs.
Data points to consider: Several FOMC members take to the stage today at 1.30pm, 5.40pm and 11.40pm GMT+1.
Levels to watch/live orders:
- Buys: 22347 ([live] stop loss: 22279).
- Sells: Flat (stop loss: N/A).
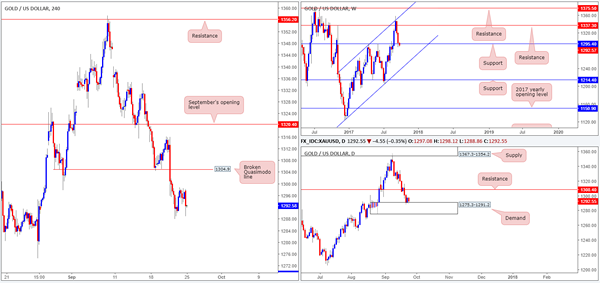
GOLD:
Weekly gain/loss: – $22.6
Weekly closing price: 1297.1
Kicking this morning’s report off with a quick look at the weekly timeframe shows price is currently seen crossing paths with support coming in at 1295.4. As you can see, the buyers have yet to register much interest here.
Sliding down to the daily timeframe, however, the candles recently connected with the top edge of a demand base logged at 1275.3-1291.2. Should the bulls hold ground here, the next upside target can be seen at resistance drawn from 1308.4. Before price can reach this level, nonetheless, daily buyers will need to contend with the H4 broken Quasimodo line at 1304.9.
Suggestions: Although a long from weekly support/daily demand looks tempting, buying into nearby H4 and daily resistances is not really our cup of tea. Along the same lines, selling at the noted H4/daily levels would, in our view, be considered courageous given the position of weekly and daily price at the moment!
On account of the above, our desk will remain on the sidelines for the time being and reassess structure going into tomorrow’s open.
Levels to watch/live orders:
- Buys: Flat (stop loss: N/A).
- Sells: Flat (stop loss: N/A).