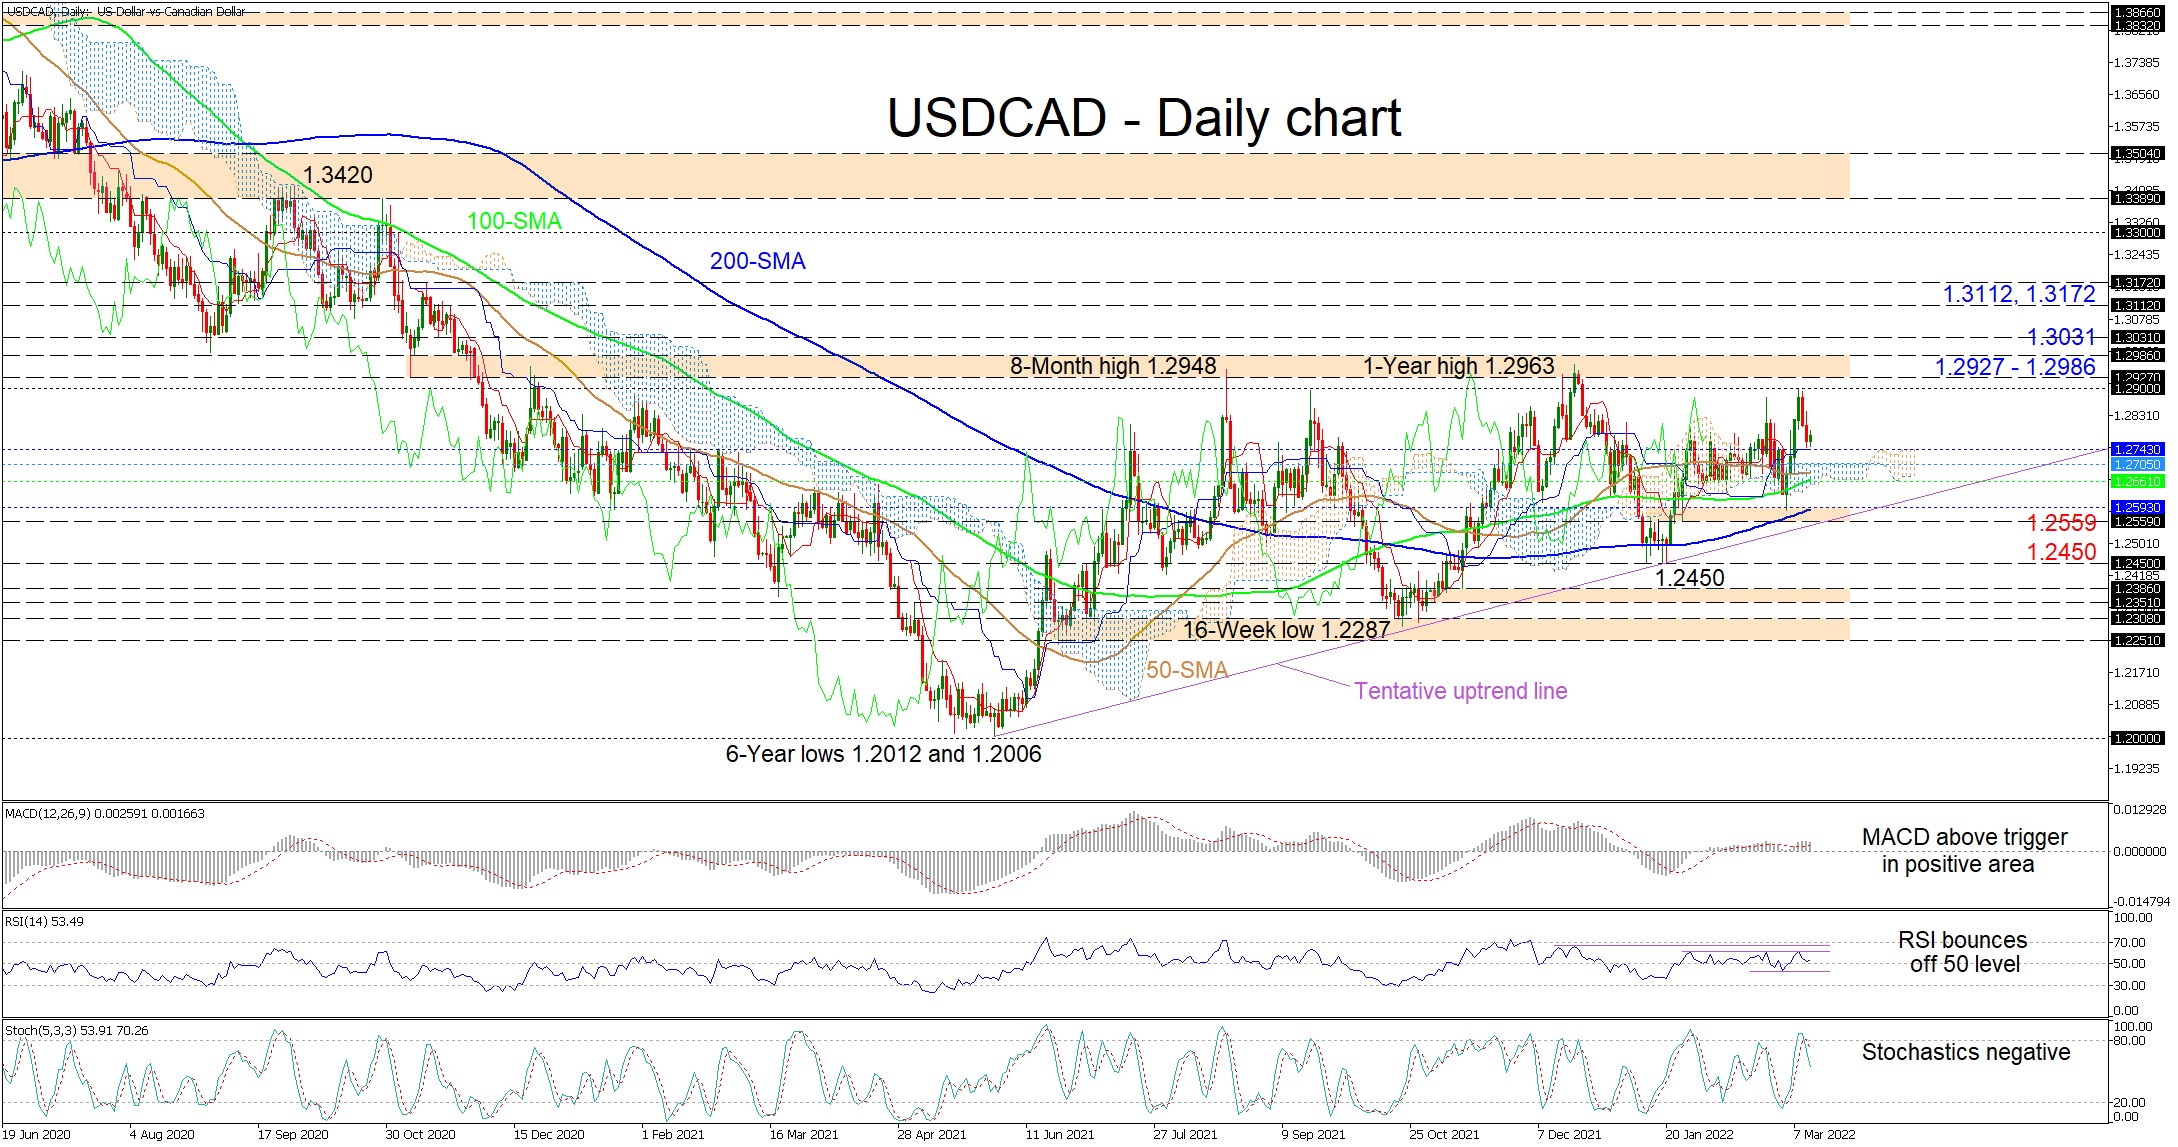
USDCAD buyers have emerged around the Ichimoku lines at 1.2743 after the fresh pullback from the 1.2900 mark. Currently, the simple moving averages (SMAs) are endorsing a neutral-to-bullish trend in the pair.
At the moment, the Ichimoku lines are not conveying any clear driving forces, while the short-term oscillators are transmitting mixed signals in directional momentum. The MACD, slightly in the positive zone, is holding above the red trigger line, while the RSI has started to turn higher just above the 50 threshold. Meanwhile, the negatively charged stochastic oscillator continues to promote additional bearish price action in the pair.
At present the price is finding footing from the Ichimoku lines around 1.2743. A price dip in the pair below the Ichimoku lines could encounter a fortified zone of support between the Ichimoku cloud’s upper surface at 1.2705 and the 100-day SMA at 1.2661. In the event sellers drive the pair beneath the cloud, the support border from the 200-day SMA at 1.2593 until the 1.2559 barrier, which overlaps with a tentative uptrend line pulled from the six-year low of 1.2006, could draw traders’ attention. A deeper retreat from here may then test the 1.2450 trough from mid-January.
Otherwise, if buyers produce positive traction off the Ichimoku lines at 1.2743, the bulls may meet initial upside constraints at the 1.2900 handle before challenging the critical 1.2927-1.2986 resistance boundary. Successfully overcoming this barricade that has capped advances since November 2020, the price could then snag at the 1.3031 level before targeting the 1.3112 and the 1.3172 highs from the second half of November 2020.
Summarizing, for USDCAD’s medium-term uptrend to remain intact, the price would need to hold above the cloud and the 1.2559-1.2593 support band. An extended dive below the 1.2450 trough would intensify negative pressures, while a climb north of the 1.2927-1.2986 ceiling could juice up upside momentum.