EUR/USD
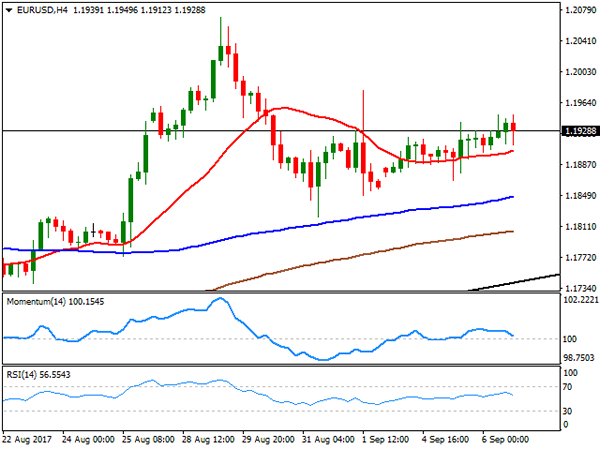
The EUR/USD pair posted another modest advance this Wednesday, ending the day not far below a weekly high of 1.1949 achieved in the US afternoon. The greenback remained under pressure during the first half of the day amid persistent risk aversion, extending its losses during the American afternoon on poor US macroeconomic figures. Germany released its July factory orders, unexpectedly down by 0.7% in the month, but with little effect over the common currency. As for the US, trade balance figures showed that the deficit shrank to 43.7B beating expectations of -44.6B, but the final services PMI for August were below expected, with the Markit index at 56.0, and the official ISM one down to 55.3 from market’s forecast of 55.8.
Focus now shifted to the upcoming ECB monetary policy decision, and how Draghi will balance a cautious stance on QE with the optimistic economic outlook. A leaked draft of the ECB’s statement made the rounds in the US afternoon, suggesting the ECB will cut its 2018/19 inflation forecast, anticipating also that they will plan the discussion over QE but won’t reach any decision until the next meeting, by the end of October. Seems unlikely Draghi would say anything negative enough to put the common currency under pressure, despite nothing would make him more happy than a weaker EUR.
The technical picture is short-term neutral for the EUR/USD pair, confined to a tight range above a still directionless 20 SMA in the 4 hours chart, but also well above the larger ones. Technical indicators in the mentioned chart have turned marginally lower above their mid-lines, lacking enough strength to indicate the upcoming direction. The pair has relevant intraday lows in the 1.1860 region, the immediate support, followed by last week’s low of 1.1822. Below this last the risk will turn towards the downside, but there’s still a long way ahead before calling it bearish. Steady gains beyond 1.2000 after the ECB’s dust settles, will open doors for gains beyond the yearly high set late August at 1.2070.
Support levels: 1.1900 1.1860 1.1820
Resistance levels: 1.1960 1.2000 1.2035
USD/JPY
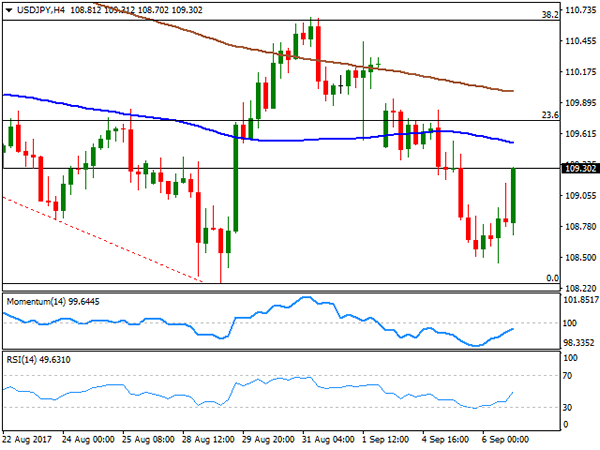
The USD/JPY pair fell to a fresh weekly low of 108.45 late Asia, changing course abruptly in the US afternoon to settle above 109.30, on the back of news indicating that the US Congress agreed on a Harvey aid package, and extending the debt ceiling to avoid defaulting. The news brought relief to the poor greenback, hit by different fronts these last few days, although across the FX board, the yen seems to be the most sensitive to the headline. Japan will release its coincident and leading indexes during the upcoming session, although market will likely remain cautious ahead of the ECB announcement later on the day. Technically, the recovery remains corrective, as despite the almost 100 pips’ advance, the pair remains below its moving averages in the 4 hours chart, also below the 23.6% retracement of the July/August decline, this last around 109.75. Technical indicators in the mentioned chart have bounced sharply from oversold readings, but remain within negative territory, overall indicating that the upward potential is limited at least as long as the price remains below the mentioned Fibonacci resistance.
Support levels: 108.60 108.10 107.70
Resistance levels: 109.00 109.35 109.80
GBP/USD
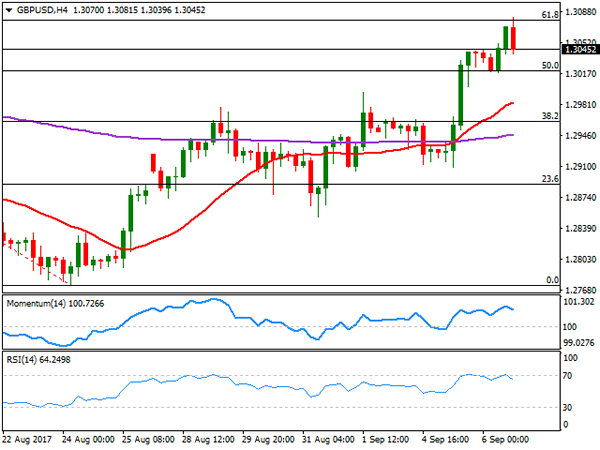
The GBP/USD pair kept advancing this Wednesday, with no negative UK headlines to alter its latest advance. The pair rallied up to 1.3081, its highest in over a month, before retreating from the 61.8% retracement of its August monthly decline, holding, however, on to gains at the end of the day. Dollar’s broad weakness was the sole responsible of Pound’s gains, as there were no macroeconomic releases coming from the UK, whilst the c calendar will remain scarce this Thursday. On Friday, however trade balance and industrial production figures for July will take center stage. Brexit negotiations remain in a limbo as the clock keeps ticking towards the 2-year term. For now, seems not a big issue for the Pound, but sooner rather than later will take its toll. In the meantime, the pair retains its positive tone in the short term, as in the 4 hours chart, it holds well above a now bullish 20 SMA, which advance well beyond the 200 EMA, this last around 1.2945. In the same chart, technical indicators are modestly retreating from overbought levels, but still well above their mid-lines. Nevertheless, the pair would need to surpass the mentioned Fibonacci resistance to be able to extend its gains, with scope then to test 1.3140 region.
Support levels: 1.3020 1.2985 1.2950
Resistance levels: 1.3080 1.3110 1.3140
GOLD
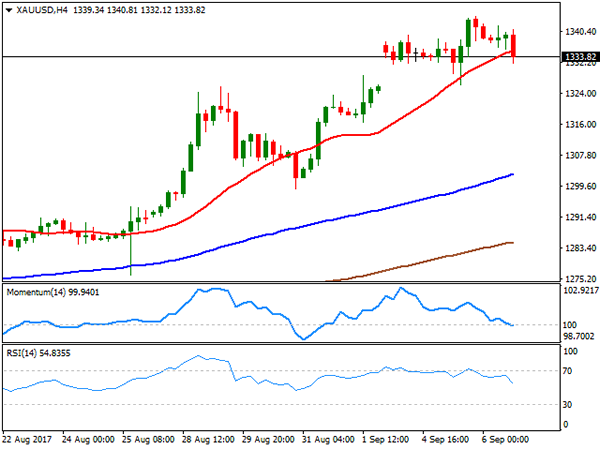
Gold trimmed all of its Tuesday’s gains, plummeting in the US afternoon as the greenback surged against safe-haven assets, on news announcing US President Trump agreed to a request from Democrats to raise the debt ceiling and extend government funding through Dec. 15, alongside with approving an aid package for the victims of Hurricane Harvey. The commodity fell to a daily low of $1,331.62 a troy ounce, and stands right above this last ahead of Wall Street’s close, pointing to its lowest settlement for the week. From a technical point of view, the commodity is poised to correct further lower, as in the daily chart, technical indicators are finally retreating substantially from overbought readings, although the price remains far above bullish moving averages, these lasts indicating that the bullish case is not over yet. Shorter term, and according to the 4 hours chart, the risk has also turned towards the downside, as the price is breaking below its 20 SMA, the Momentum is entering negative territory with a strong downward slope, whilst the RSI also heads, south, but currently at 53. The weekly low was set at 1,326.40, while Friday’s close comes at 1,324.21, making of the region around 1,325.00 a strong support level, and a line in the sand ahead of a steeper declines for this Thursday.
Support levels: 1,331.60 1,325.00 1,318.40
Resistance levels: 1,338.50 1,344.30 1,352.55
WTI CRUDE OIL
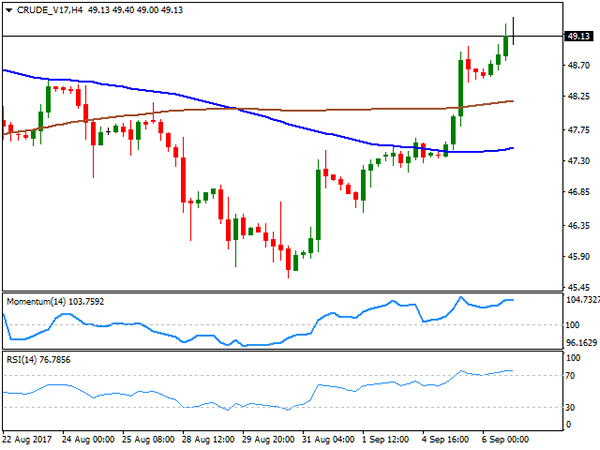
Crude prices keep advancing this Wednesday, with the US benchmark settling at $49.10 a barrel, its highest settlement in nearly a month. The commodity maintains the positive tone amid renewed demand for crude after the Hurricane Harvey passed through Texas, and ore refineries are resuming activity. A new Hurricane in the area, Irma, also helped lifting prices, on fears it will hurt US oil production. News that Russia and Saudi Arabia may extend the output cut, added to the bullish case. The daily chart shows that the price moved one step further towards the 200 DMA, but closed right below it, whilst technical indicators have extended beyond their mid-lines, maintaining their strong upward momentum ahead of the API release. In the 4 hours chart, the price is far above its 100 and 200 SMAs, while technical indicators consolidate within overbought readings, far anyway from suggesting upward exhaustion. The 50.00 level is a tough bone to break, yet if WTI manages to break above it, 52.00 becomes a more than likely bullish target.
Support levels: 48.20 47.70 47.15
Resistance levels: 49.40 49.90 50.40
DJIA
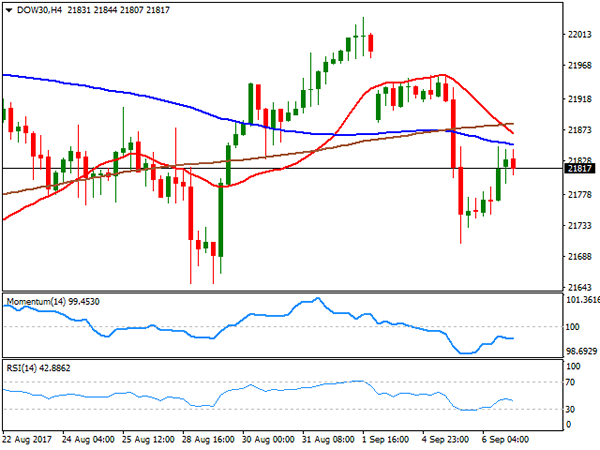
Wall Street closed with gains, with the DJIA adding 54 points, to 21,807.64, and the Nasdaq Composite up 0.28%, to 6,393.31. The S&P added 7 points and settled at 2,465.54. Backing the rally were higher energy prices, as oil began recovering post-Harvey, while US lawmakers reached a deal to extend the debt ceiling until December. Home Depot was the best performer within the Dow, up 2.37%, followed by Chevron that gained 2.15%. Exxon was also within the top 10 winning list, after gaining 2.07%. United Technologies, on the other hand, was the worst performer, losing 1.42%. The index trimmed part of its Tuesday’s losses, but further gains are still at doubt, as in the daily chart, the intraday advance stalled around the 20 SMA, while technical indicators have turned modestly higher, but are currently within neutral territory. In the shorter term an according to the 4 hours chart, the index remains below all of its moving averages, with the 20 SMA maintains a sharp downward slope, whilst technical indicators have corrected oversold conditions, but are currently resuming their declines within negative territory, limiting chances of further gains as long as the index remains below 21,845, the daily high.
Support levels: 21,795 21,758 21,721
Resistance levels: 21,845 21,891 21,932
FTSE100
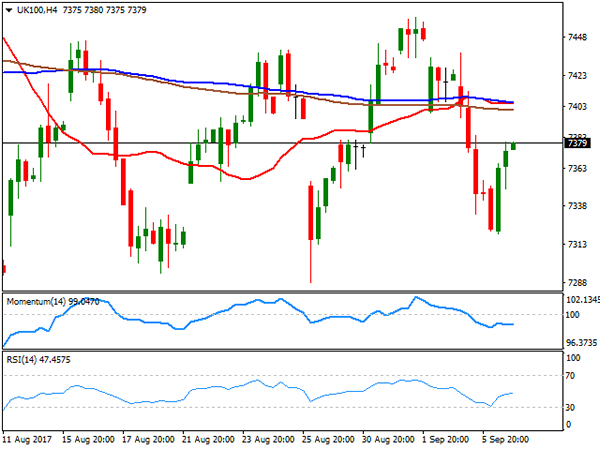
The FTSE 100 remained under pressure this Wednesday down 18 points, to close at 7,354.13, as despite market mood improved modestly, the Footsie was weighed by a strong Pound. Despite most members closed higher, the benchmark was dragged lower by Barratt Developments, which shed 4.57%, as despite posting a record annual profit, it offered a forecast of only "modest growth" in the next financial year. Micro Focus International added 6.16% leading advancers, and followed by Next that gained 2.51%. The index has partially recovered previous losses, but is still looking bearish according to the daily chart, as it held below a bearish 20 DMA which extends its decline below the 100 DMA, while technical indicators remain within bearish territory, although with limited directional strength. Shorter term and according to the 4 hours chart, the risk is also towards the downside as the index keeps developing below all of its moving averages, anyway converging directionless in the 7,400 region, whilst technical indicators seem to be resuming their declines within bearish territory.
Support levels: 7,333 7,288 7,241
Resistance levels: 7,400 7,444 7482
DAX
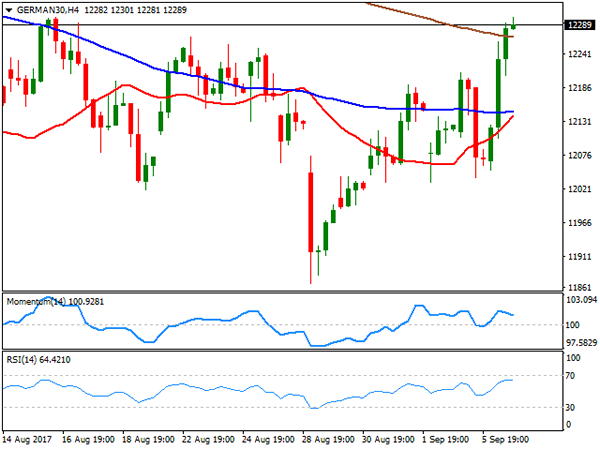
European equities closed marginally higher, led by the German DAX, as the automotive sector was lifted by rating upgrades. The benchmark added 90 points, to end at 12,214.54, with Daimler being the best performer, up by 4.34%, followed by Volkswagen which added 2.98% after Goldman Sachs upgraded the first from neutral to buy. Deutsche Bank added 2.13% after its CEO said that the ECB should begin tapering, in spite of a strong EUR. Only E.ON closed in the red, down 0.56%. The index gained upward potential according to the daily chart, surpassing sharply its 20 DMA, and with technical indicators maintaining strong upward slopes within positive territory. In the 4 hours chart, the index settled a few points above its 200 SMA for the first time in almost two months, and far above the shorter ones, whilst technical indicators have lost part of their upward strength, but remain within positive territory. ECB’s announcement this Thursday will be the main market motor for the index.
Support levels: 12,241 12,207 12,166
Resistance levels: 12,301 12,342 12,383