
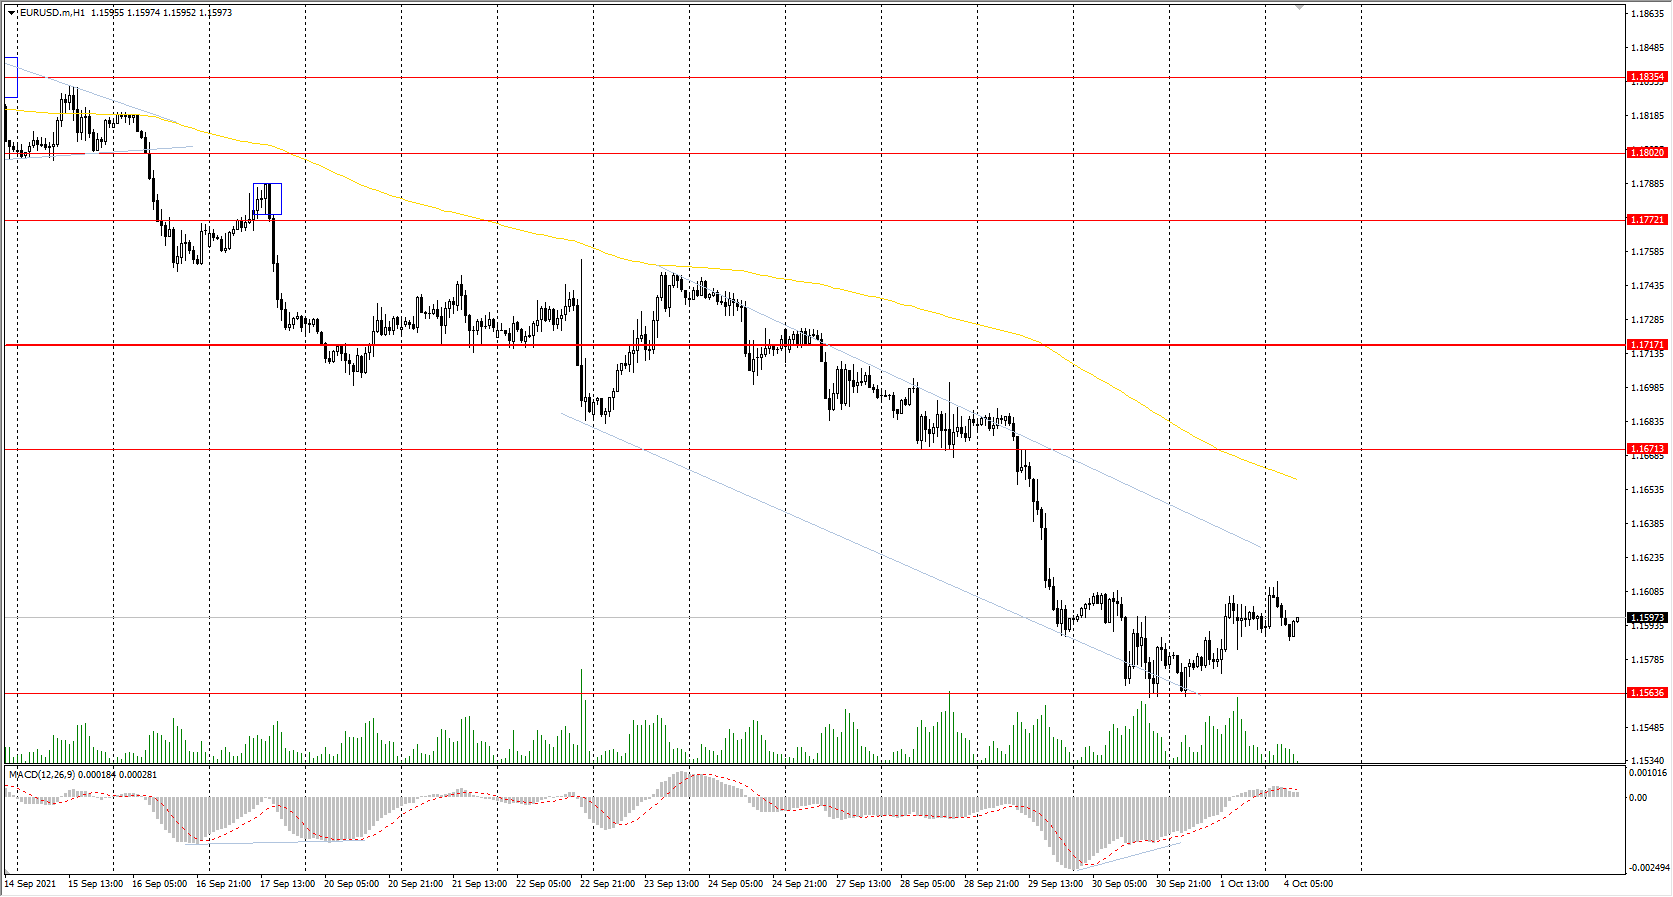
The EUR/USD currency pair
Technical indicators of the currency pair:
Prev Open: 1.1576
Prev Close: 1.1593
% chg. over the last day: +0.14%
Against the background of a sharp rise in energy prices, inflation in the Eurozone jumped to 3.4%, reaching its highest level in 13 years. Because of the rise in inflation, workers in Germany started to strike and demand higher wages to cover the price increases.
Trading recommendations
Support levels: 1.1564, 1.1453
Resistance levels: 1.1671, 1.1717, 1.1772, 1.1802, 1.1835
From the technical point of view, the EUR/USD trend is bearish. But the MACD indicator has become inactive. It indicates that the sellers have stopped putting pressure. Under such market conditions, traders should consider sell deals from the resistance levels near the moving average, as the price has deviated from the middle line. Buy trades should be considered only from the support levels with additional confirmation in the form of a buyers’ initiative.
Alternative scenario: if the price breaks out through the 1.1717 resistance level and fixes above, the mid-term uptrend will likely resume.
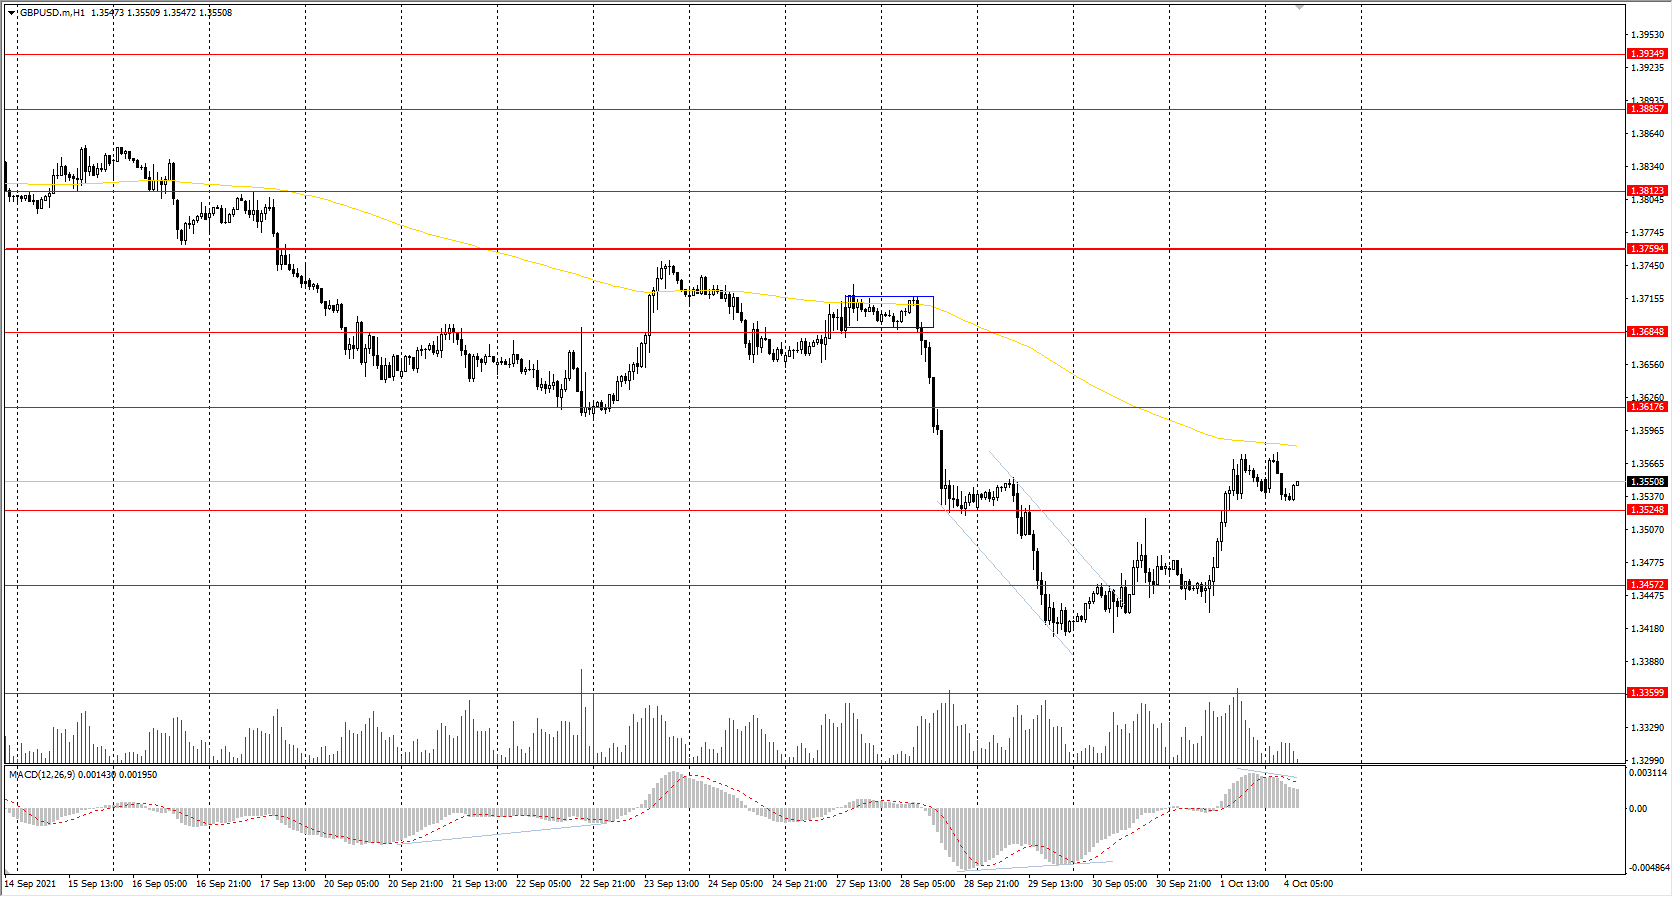
The GBP/USD currency pair
Technical indicators of the currency pair:
Prev Open: 1.3472
Prev Close: 1.3543
% chg. over the last day: +0.53%
In the UK, the manufacturing PMI index unexpectedly increased to 57.1 value (previously 56.3). The UK plans to resume fuel deliveries across the country starting from Monday. Leaders in Scotland, Wales and Northern Ireland have asked the government not to cut the social benefits. This program involves paying £20 a week to about 5.5 million families.
Trading recommendations
Support levels: 1.3525, 1.3457, 1.3360, 1.3282
Resistance levels: 1.3617, 1.3685, 1.3759, 1.3812, 1.3886
On the hourly time frame, the GBP/USD trend is bearish. But the British currency sharply strengthened on Friday. The MACD indicator has become positive. Buy trades should be considered only throughout the day and only with short targets from the support levels after the buyer’s initiative. Sell trades can be found at the resistance levels near the moving average line.
Alternative scenario: if the price breaks out through the 1.3759 resistance level and consolidates above, the bullish scenario will likely resume.
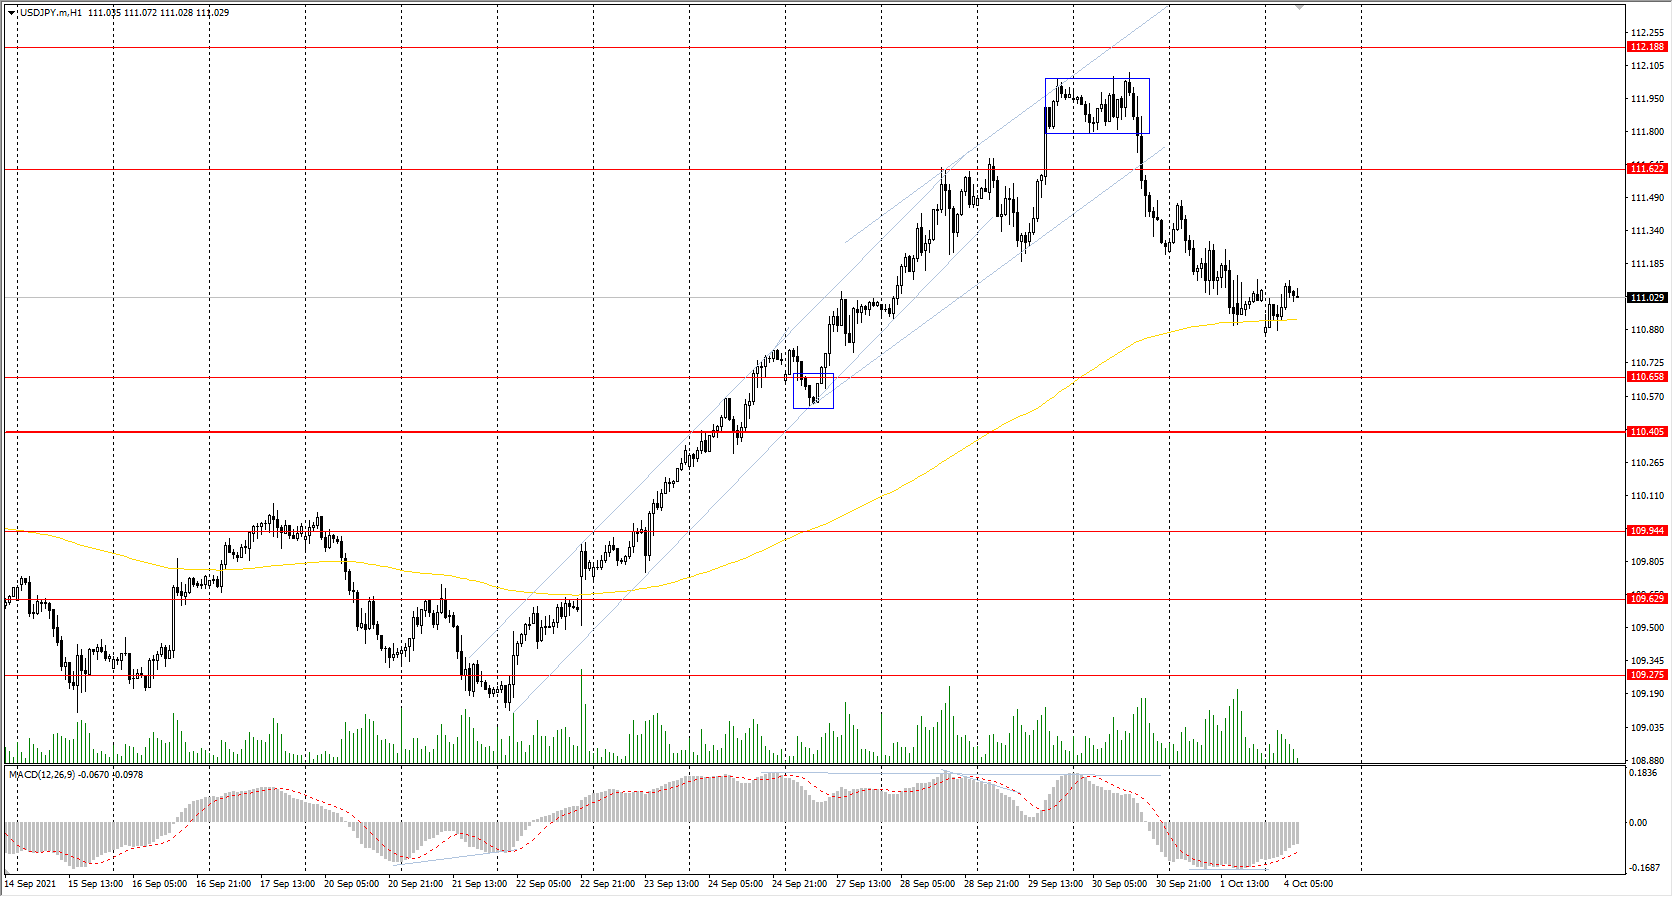
The USD/JPY currency pair
Technical indicators of the currency pair:
Prev Open: 111.24
Prev Close: 111.06
% chg. over the last day: -0.16%
Amid the ongoing economic recovery, the Tankan Index, which measures confidence in Japan’s economy among large companies, increased to its highest level in almost three years in July-September.
Trading recommendations
Support levels: 110.65, 110.40, 109.95, 109.63, 109.27
Resistance levels: 111.62, 112.19
The main trend of the USD/JPY currency pair is bullish. The MACD indicator became negative, but there are signs of divergence. Under such market conditions, it’s better to look for buy positions from the support levels near the moving average. Sell positions should be considered only throughout the day from the resistance levels, given there is sellers’ initiative.
Alternative scenario: if the price falls below 110.45, the uptrend is likely to be broken.
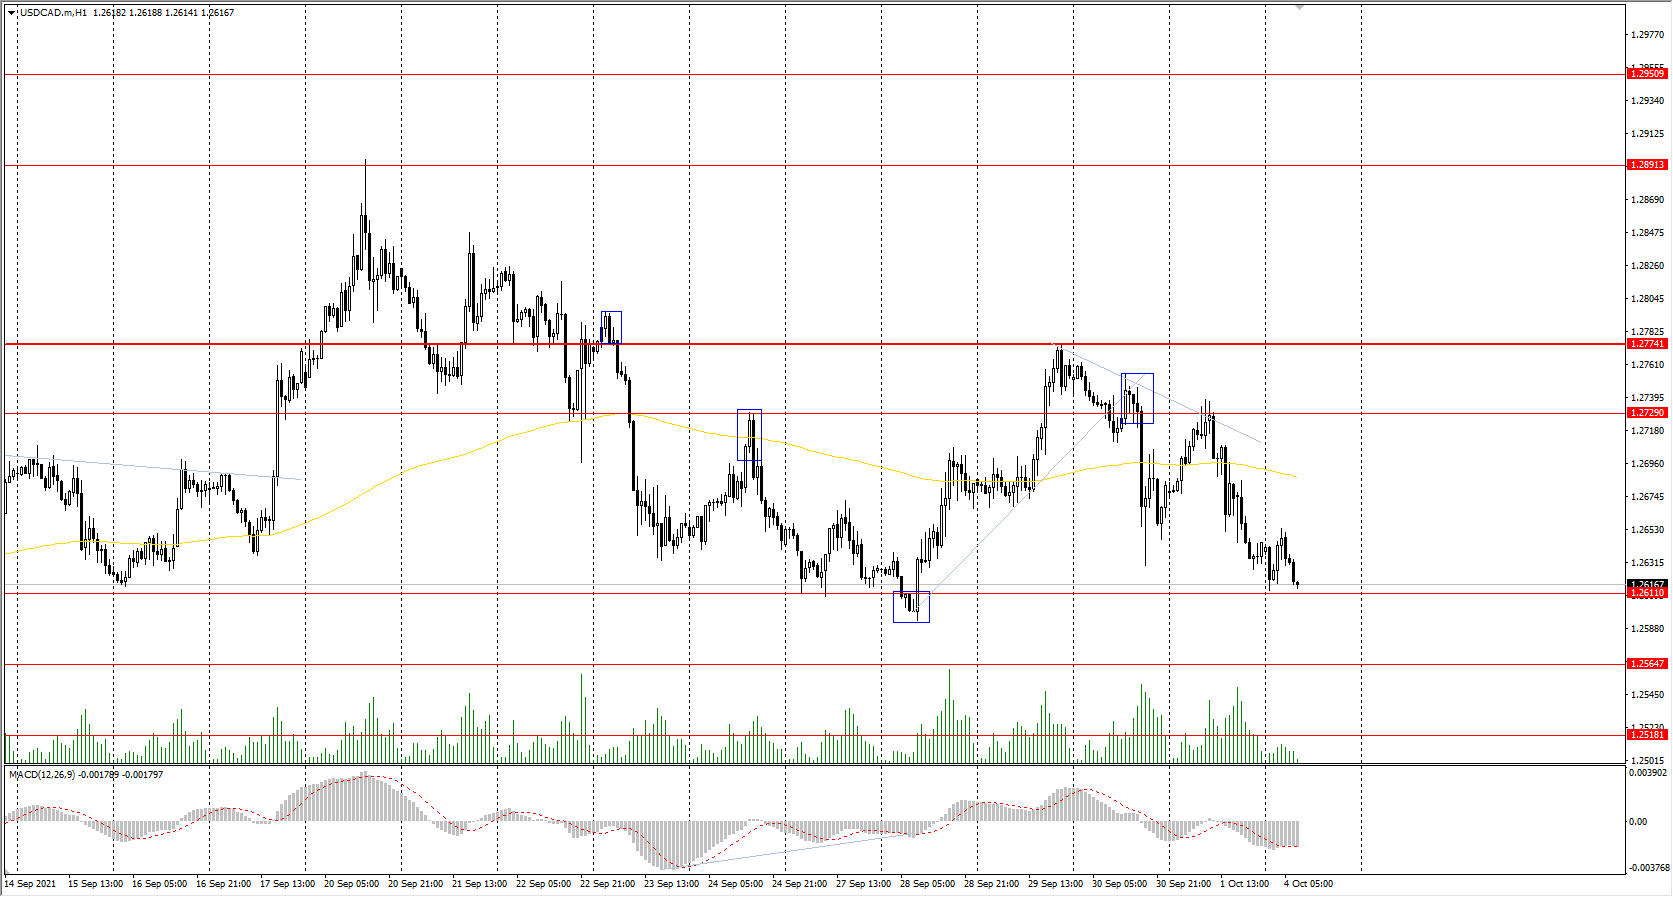
The USD/CAD currency pair
Technical indicators of the currency pair:
Prev Open: 1.2677
Prev Close: 1.2645
% chg. over the last day: -0.25%
The Canadian dollar is a commodity currency, so USD/CAD is highly dependent on the dynamics of the dollar index and oil prices. The dollar index remained at the same level on Friday while oil prices increased. As a result, the USD/CAD quotes decreased due to the strengthening of the Canadian currency. Canada’s GDP fell by 0.1% in July. Growth is expected in August.
Trading recommendations
Support levels: 1.2611, 1.2565, 1.2518, 1.2425
Resistance levels: 1.2729, 1.2774, 1.2891
From the technical point of view, the trend of the USD/CAD currency pair is bearish. The MACD indicator has become negative, and there are signs of sellers’ pressure. Under such market conditions, it is better to look for sell deals from the resistance levels after the seller’s initiative in the form of impulse movement. Buy trades should be considered from the support levels, but only with short targets.
Alternative scenario: if the price breaks out through the 1.2774 resistance level and fixes above, the uptrend will likely resume.
News feed for 2021.10.04:
- OPEC+ Meeting at 13:00 (GMT+3).