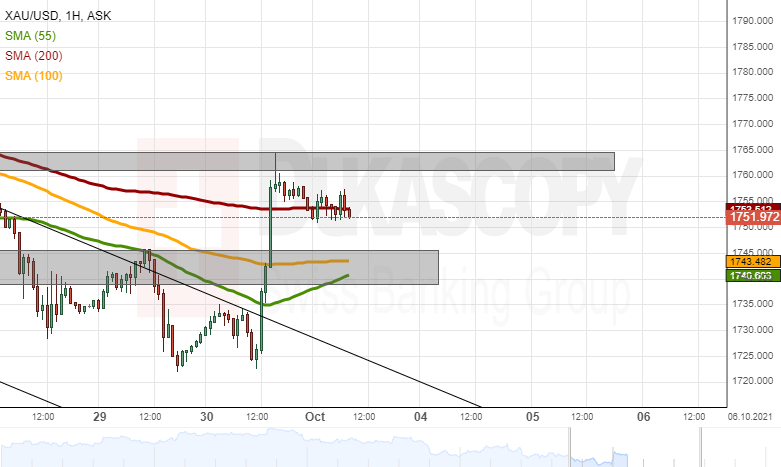
The yellow metal has clearly broken the resistance of the channel down pattern. It occurred in a sharp four hour jump, which also passed the resistance of the 55, 100 and 200-hour simple moving averages. Eventually, the metal’s price was stopped by the 1,765.00 level’s resistance.
On Friday, the pair traded sideways around the 200-hour SMA and the 1,755.00 level.
If the metal’s price surges, it would once again test the resistance of the 1,765.00 mark. On the other hand, a potential decline could find support in the 1,745.00 level and the 55 and 100-hour simple moving averages.