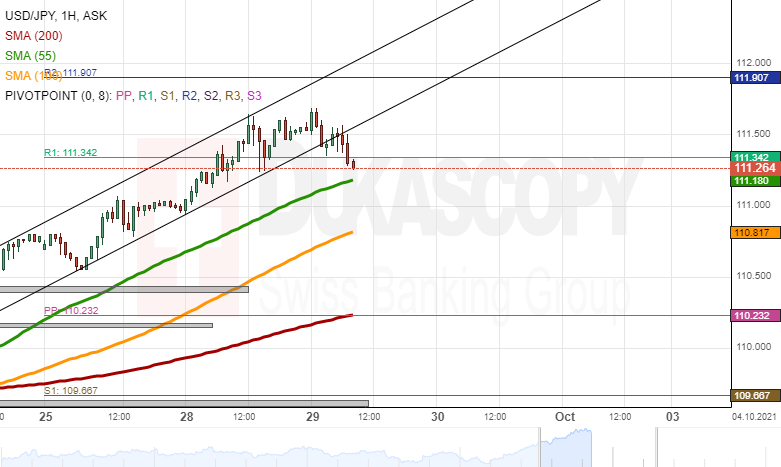
Since September 23, the USD/JPY was sharply surging in a channel up pattern. On Wednesday morning, the rate booked a new high level, as it touched the 111.68 level. However, the booking of the new high level was followed by a decline. The decline passed below the lower trend line of the narrow channel up pattern, which captured the rate’s surge.
The decline of the pair could find support in the 55-hour simple moving average near the 111.20 level. Below the 55-hour SMA, the 100-hour simple moving average near 110.80 could provide support. Meanwhile, note that the simple R1 simple pivot point at 111.34 managed to provide support for a couple of hours during Wednesday’s morning hours.
In the case of the USD/JPY recovering, the pair might find resistance, first in the weekly R1 simple pivot point at 111.34. Afterwards, the weekly R2 simple pivot point at 111.91 could act as resistance. Above the pivot points, the 112.00 level could hold the pair down.