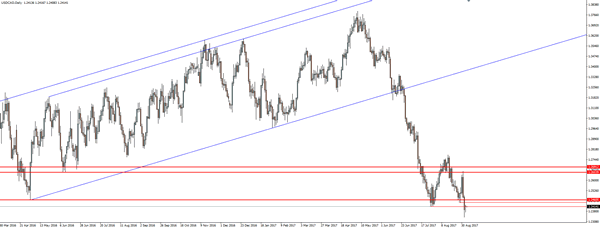
After the stellar Canadian GDP numbers last week, we blogged about the possibility of the Bank of Canada hiking rates, which would lead to further selling in USD/CAD.
Take a look at the updated daily chart where not much has changed from our last look:
USD/CAD Daily:

What you can see however, is that support level we were watching has now broken. If you didn’t get long off the failure at resistance when the GDP number was released, then this is a juicy higher time frame level that you can start to look at managing your risk around.
Now zoom into the intraday charts and let’s take a look at the price action:
USD/CAD 4 Hourly:

I’ve used a 4 hourly chart on this occasion, simply because it clearly shows the swing low levels that we’ve been watching for previous support to possibly turn to resistance.
As long as price is below the daily support level, the intraday zone that I’ve marked with the thinner lines is the key level to look for a turn.
