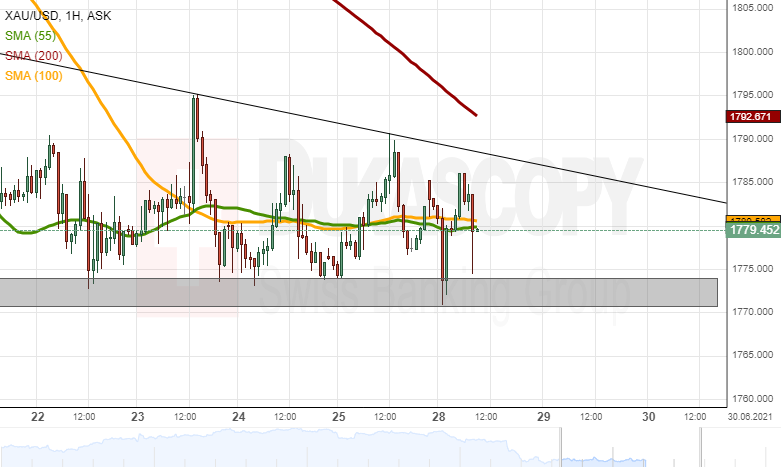
Starting the week, analysts spotted a descending triangle pattern on the yellow metal’s hourly candle chart. The price has been trading between a support zone at 1,770.00/1,775.00 and a descending trend line since June 21. In theory, the commodity price would trade in the pattern until a break out from it occurs.
If the price breaks out to the upside, it would most likely face the resistance of the 200-hour simple moving average near 1,790.00. Afterwards, the 1,800.00 mark would be reached.
On the other hand, a passing of the 1,770.00/1,775.00 zone could result in a decline to the 1,750.00 mark.