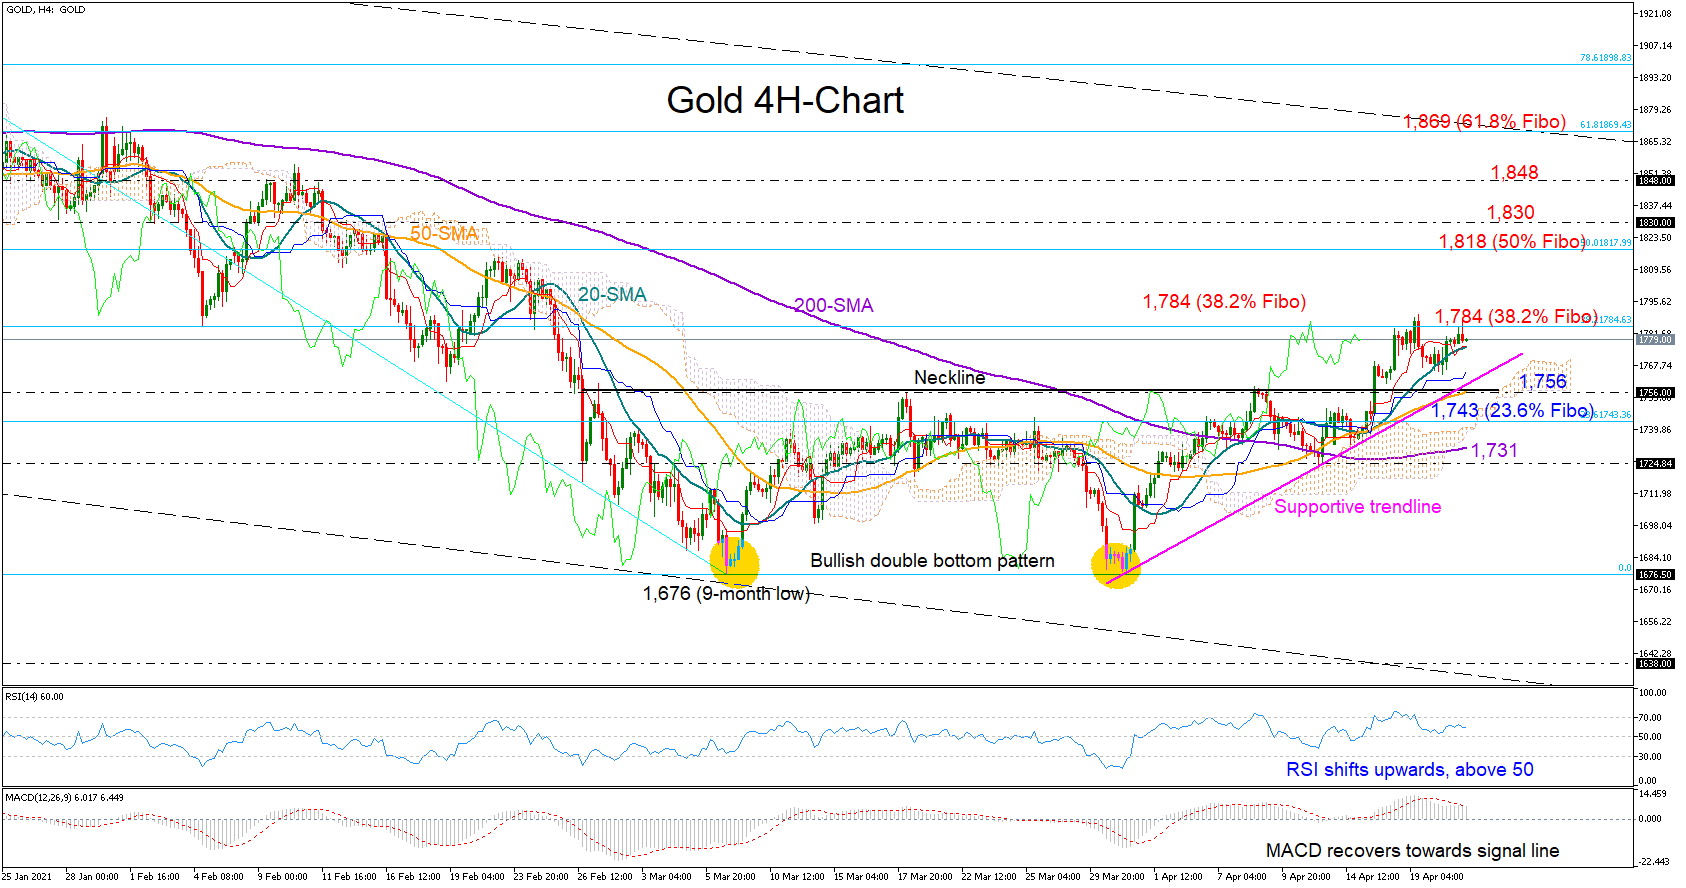
Gold is defending its bullish double bottom structure above the key 1,768 support region and the 20-period simple moving average (SMA) on the four-hour chart following the pullback from an almost two-month high of 1,789.
The 38.2% Fibonacci retracement of the 1,959 – 1,676 down leg at 1,784 has been under examination over the past few days in the hope that any significant step higher would prompt an exciting rally towards the 50% Fibonacci of 1,818 in the absence of any tough obstacles.
The upside reversal in the RSI, the recovery in the MACD, as well as, the bullish gap between the red Tenkan-sen and Kijun-sen lines are endorsing additional upside corrections in the market. The positive SMA intersections are further brightening the outlook. Should the precious metal spike above 1,830, the next stop could be around 1,848.
On the flip side, a downside correction below the 20-period SMA could hit a wall within the 1,756 – 1,760 zone formed by the protective trendline and the broken neckline of the double bottom pattern. The 50-period SMA is also positioned in the same location, making any violation here crucial to watch. However, for a deep downfall towards the 200-period SMA, sellers should first pierce the 23.6% Fibonacci of 1,743.
Summing up, gold is expected to set up another bullish run in the short-term, but a confirmation above 1,784 is required to activate new buying orders.