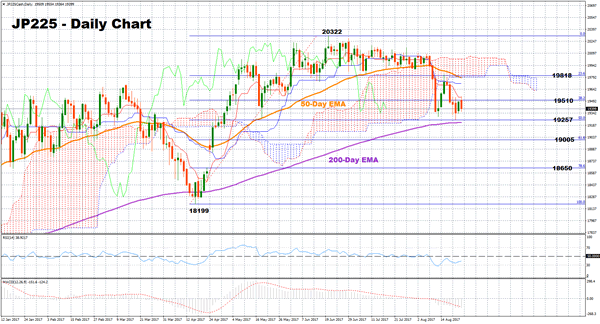
The Japan 225 stock index consolidated for six weeks after it touched a two-year high of 20322 on June 20. Then, on August 8 the index followed a bearish path, crossing below the Ichimoku cloud and the 50-day exponential moving average (EMA).
According to the technical indicators, the picture in the short term is bearish. The RSI has continued trending below its neutral zone even after emerging from oversold area on August 11, while the MACD has been moving in a negative territory since August 8. The negative alignment between the Kijun-sen and the Tenkan-sen which is still intact since July 20 also gives an additional bearish evidence.
If the index extends its current downtrend, the 50% Fibonacci level at 19257 of the upleg from 18199 to 20322 (April – June) would provide an immediate support. Any violation of this point would likely push prices further down and shift focus to the point of 19005, which is also the 61.8% Fibonacci, while the 78.6% Fibonacci at 18650 could act as an additional barrier to downside movements.
On the other hand, a market action to the upside would first touch the 38.2% Fibonacci of 19510, which was tested recently, before it meets resistance at the 23.6% Fibonacci of 19818. The latter is considered a strong area as the 50-day EMA and the bottom of the Ichimoku cloud are also located in this zone. From here, the index would target June’s two-year high of 20322 as a resistance.
Regarding the medium-term outlook, the index looks neutral as long as it ranges between 19261 and 20322.

