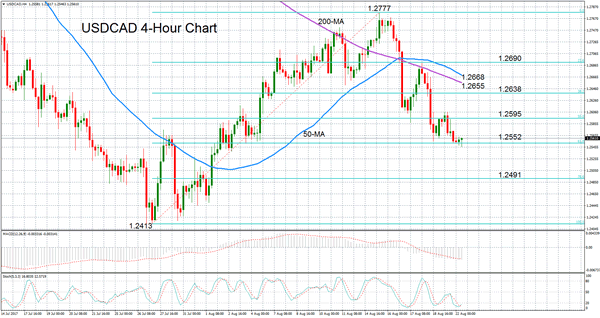
USDCAD is showing little sign of ending the current bearish run that began on August 15, with the pair hitting a 2-week low of 1.2546 earlier today. This low is just below the 61.8% Fibonacci retracement level of the July-August uptrend from 1.2413 to 1.2777.
Technical indicators remain in bearish area with the MACD deep below zero and still declining. However, the stochastics are in oversold territory and the %D line is attempting to cross above the %K line, suggesting a possible easing of the downside momentum.
Should we see an upside push, resistance will likely come from the 50% Fibonacci retracement level of 1.2595, followed by the 38.2% Fibonacci level at 1.2638. Further up, the 200- and 50-period moving averages (currently at 1.2655 and 1.2668, respectively) could stand in the way of prices reaching the 23.6% Fibonacci level at 1.2690.
If the pair fails to hold above the 61.8% Fibonacci support level of 1.2552, further losses would lead the way towards the 78.6% Fibonacci level of 1.2491. A break below this mark would clear the way to July’s 2-year trough of 1.2413. A breach of this low would signal a resumption of the longer-run downtrend that began in May and reinforce the bearish outlook in the medium term.

