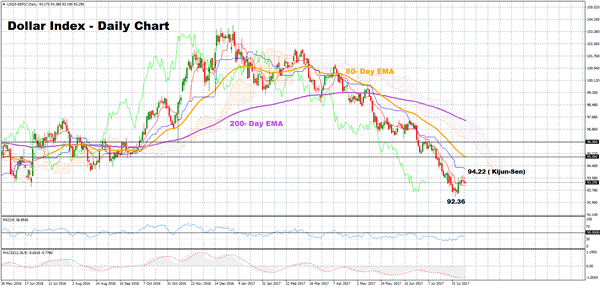
The dollar index has continued extending its downtrend that started on January 4. After it touched a 15-month low on August 2, it bounced up moderately, but both the short-term and the medium-term outlook remain bearish.
According to the technical indicators, the index is bearish in the short-term. The RSI has been fluctuating below the neutral zone of 50 since May 11, while it managed to break above the oversold area (July 20) on August 4. The MACD has been trending in negative territory since March 22. Another bearish evidence arises from the index itself, as it is currently deviating below the 50-day and the 200-day exponential moving averages (EMA) and the Ichimoku cloud.
Should the price head up, an immediate resistance would be found around the Kijun-sen point of 94.22 which was also tested in August 2016. Then, another resistance would be met at the 95-psychological level before it targets the 96 key-mark as its next barrier. However, if the price hits above the 50-day EMA, the bias is likely to turn from bearish to neutral.
Alternatively, a move to the downside would meet the 15-month low of 92.36 (August 2) as a support, while if this level fails to hold, the 91.87 low reached in May 2016 could provide an additional support. Any decline from this point would shift focus to the 91-psychological mark.
Regarding the medium-term outlook, it is bearish as the index has been making lower highs and lower lows in the last three months. Moreover, the bearish cross between the 50-day and the 200-day EMA on May 24 is still in effect with both EMA currently negatively sloping.

