Currency pair EUR/USD
The EUR/USD bearish retracement indeed turned at the support zone (blue lines) as expected in yesterday’s wave analysis. Considering the divergence on this 4 hour chart, the bearish price action could be just one part of larger ABC (purple) retracement within wave 4 (green).
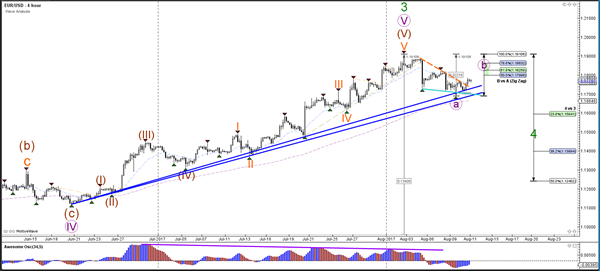
The EUR/USD broke above the resistance (dotted orange) of yesterday’s falling wedge chart pattern and could moving towards the Fibonacci levels of wave B vs A which could act as potential resistance spots.
Currency pair USD/JPY
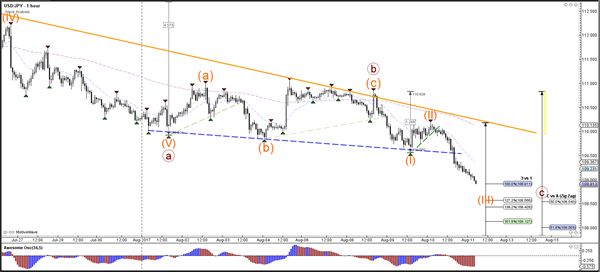
The USD/JPY is breaking below the larger support trend line (blue) from the daily support at 109.50. This bearish break could indicate a downtrend continuation within wave C (brown).
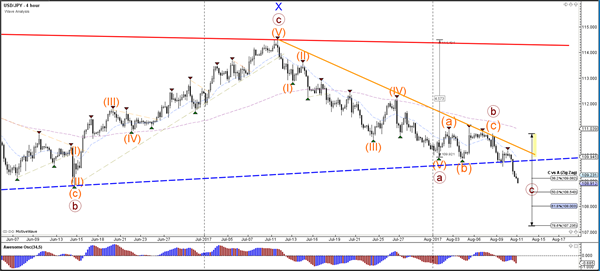
The USD/JPY is breaking below the larger support trend line (blue) from the daily support at 109.50. This bearish break could indicate a downtrend continuation within wave C (brown).
Currency pair GBP/USD
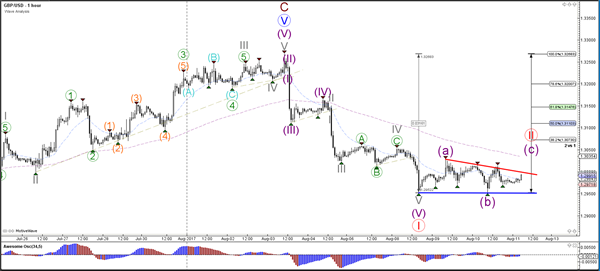
The GBP/USD seems to have completed 5 bearish waves within wave 1 (red). The Cable could be building a potential bullish retracement as part of a wave 2 (red).
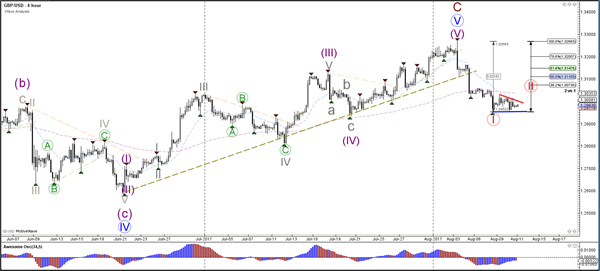
The GBP/USD has support and resistance trend lines which could offer breaking spots for the Cable. A bullish breakout could lead to a wave C (purple) whereas a bearish break could see the downtrend continue.