
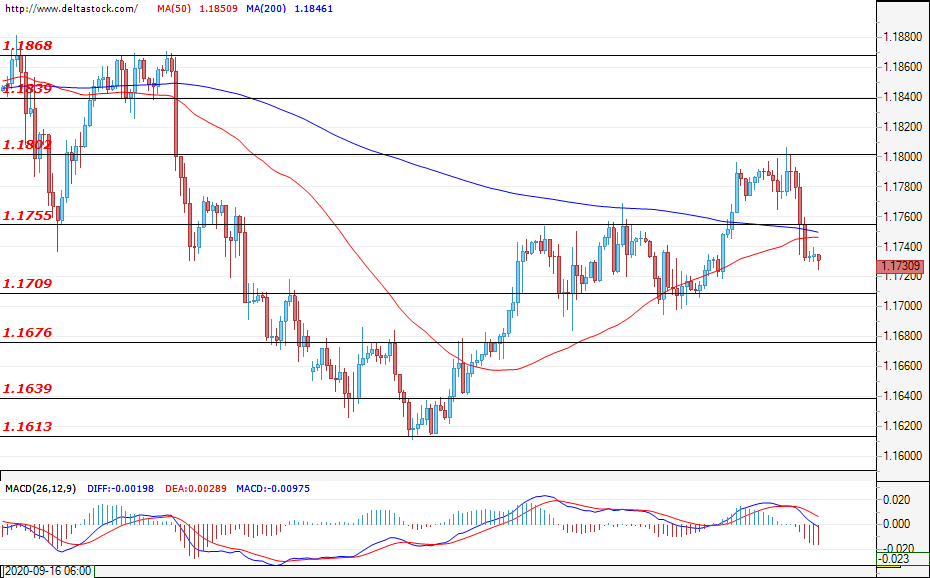
EUR/USD
Current level – 1.1730
The rise of the euro was limited by the resistance at around 1.1800 and a wave of sell-offs in the last trading hours drove the pair in the red. It’s possible for the meltdown to resume today, with first support being the level of 1.1709. First resistance for the bulls is the level of 1.1755 and, in order to preserve the recovery, it’s desirable for the bulls to make a rally towards 1.1800, thus turning the price drop into a corrective move.
| Resistance | Support | ||
| intraday | intraweek | intraday | intraweek |
| 1.1755 | 1.1840 | 1.1709 | 1.1640 |
| 1.1800 | 1.1870 | 1.1676 | 1.1610 |
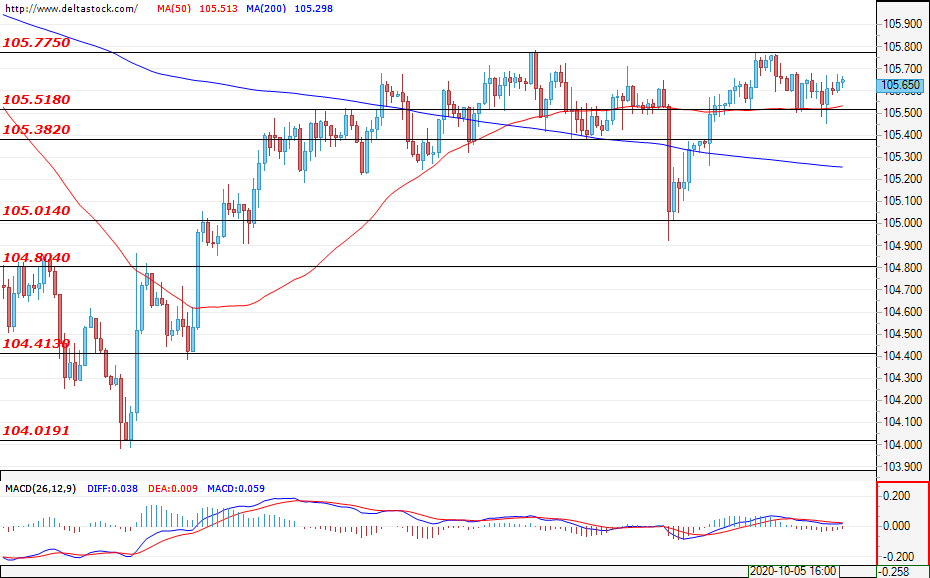
USD/JPY
Current level – 105.65
The pair continues to trade in the range between 105.38 and 105.77. Buyers could expect to find daily support at around 105.51. The unsuccessful attempt at breaching 105.38 and the aggressive purchases at around 105.00 could be considered as preparation for a breach of the resistance at 105.77. If this scenario rings true, the next target for the bulls would be the level at around 106.28.
| Resistance | Support | ||
| intraday | intraweek | intraday | intraweek |
| 105.77 | 106.30 | 105.51 | 105.01 |
| 106.00 | 107.20 | 105.38 | 104.80 |
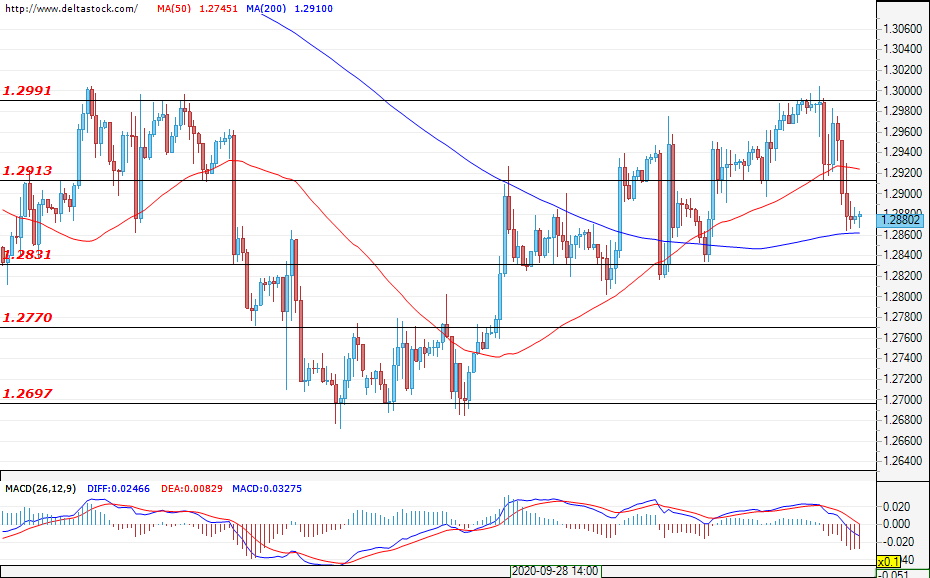
GBP/USD
Current level – 1.2880
The resistance at 1.2991 proved to be solid and bulls failed to overtake it. Bearish pressure turned out to be strong and the support at 1.2913 was breached after the bounce. The market is currently found in a channel phase and local support and resistance levels are being easily breached. The first support with the potential to limit the sell-offs is found at 1.2830, while key resistance is found at 1.2991. It’s possible for the buyers to once more reach 1.2991. If this level is breached, the market can shift towards an uptrend. If bulls fail that task, the current channel might become a range, with bears having the upper hand and possibly trying to take the market down to the lows at 1.2697.
| Resistance | Support | ||
| intraday | intraweek | intraday | intraweek |
| 1.2913 | 1.2991 | 1.2831 | 1.2697 |
| 1.2991 | 1.3050 | 1.2770 | 1.2530 |