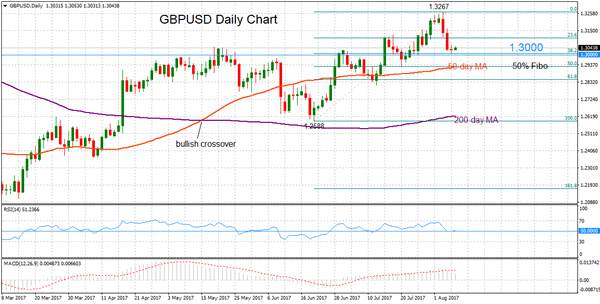
GBPUSD hit an 11-month high of 1.3267 last week before losing upside momentum and reversing back towards the key psychological level of 1.3000. The overall market structure on the daily chart remains bullish and the current move lower is viewed as a corrective phase as long as the price remains above 1.3000.
Support at 1.3000 is considered strong as it also happens to be close to the 38.2% Fibonacci retracement of the recent rally from 1.2588 to 1.3267. This level appears to be holding so far and if it continues to be respected then a bounce higher would open the way towards 1.3100 with scope to re-test the 1.3267 high. Clearing this peak would strengthen the uptrend from June for a continuation of higher highs and higher lows. The next major high is at 1.3480.
Should support at 1.3000 fail to hold, then this would turn the bias back to the downside. The next target would be at 1.2926. This is the 50% Fibonacci retracement level and also where the 50-day moving average (MA) is converging. This level is also close to the July 20 low. A breakdown below would start to change the trend and increase bearish momentum towards the 1.2800 area before reaching the June 21 low at 1.2588.
In the near-term a consolidation phase is expected just above the 1.3000 level. RSI is holding above but close to the 50 line which separates bullish from bearish territory. There are no clear signs of a reversal from the recent uptrend – the bullish crossover on May15 when the 50-day MA moved above the 200-day one is supporting a bullish market structure. The MACD though is not clearly giving a bullish picture – the indicator is hand positive but below the red signal line.

