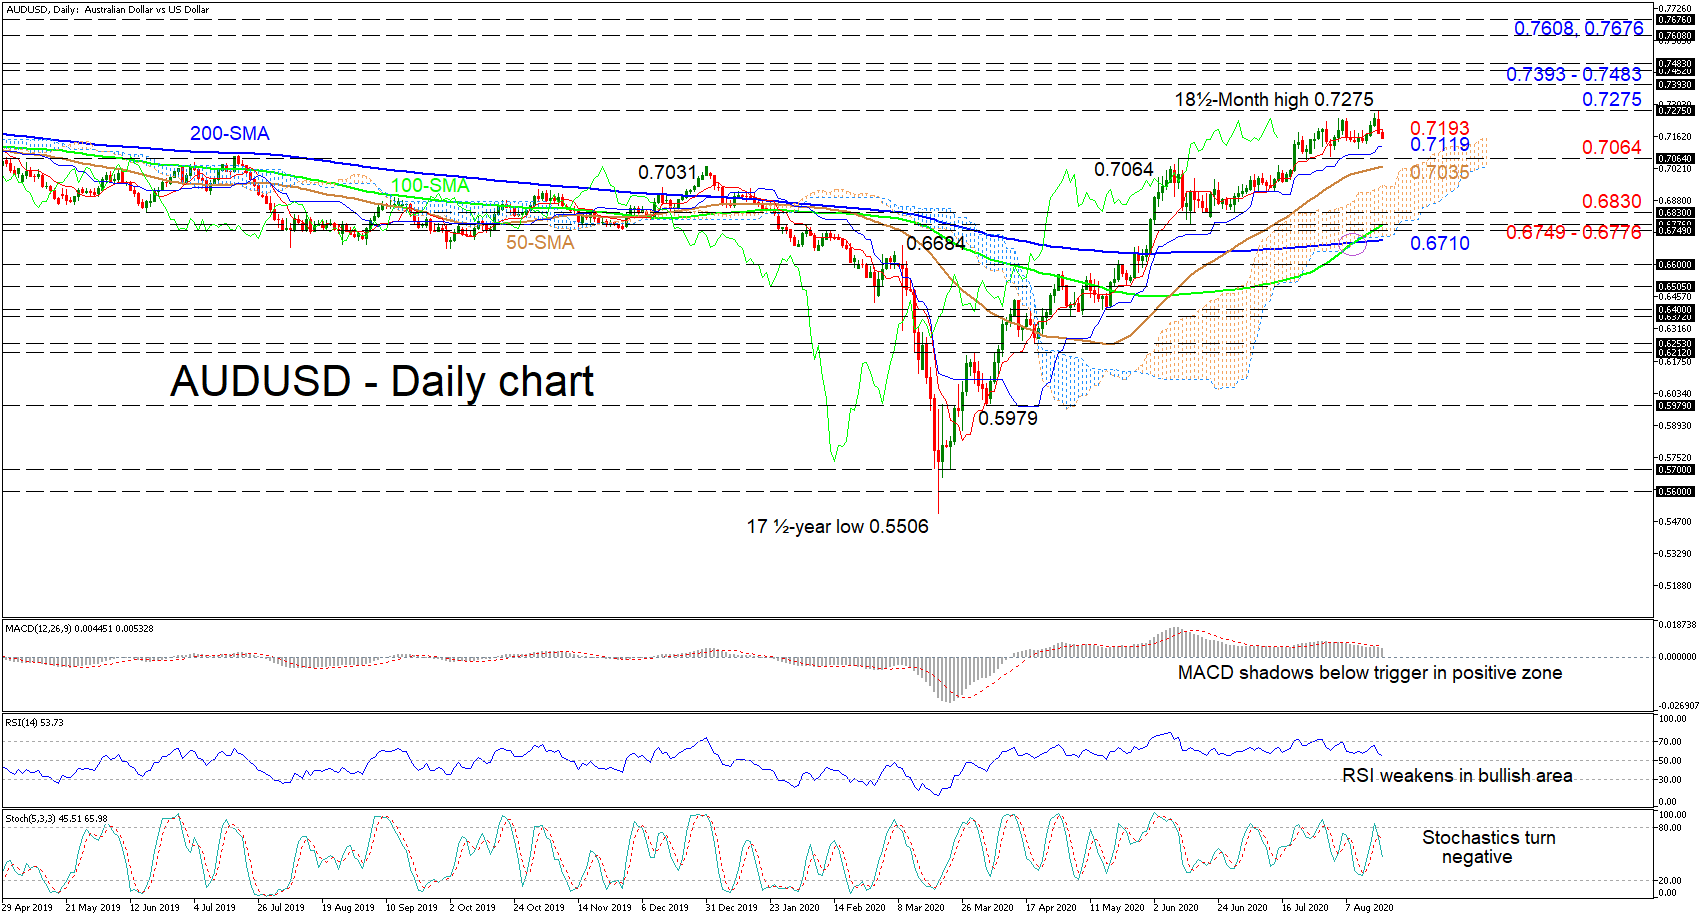
AUDUSD has managed to preserve its five-month progression from the 17½-year low of 0.5506 to the fresh high of 0.7275. The bullish simple moving averages (SMAs) and the positive demeanour of the Ichimoku lines continue to convey optimism in the pair, despite its recent weakening.
The technical oscillators mirror the current pullback in the pair displaying the fading in positive momentum. The MACD, in the positive region, is cautiously trailing below the red signal line, while the RSI is waning in bullish territory. Moreover, the stochastic oscillator has turned negative promoting vulnerability in the pair.
If selling interest prevails, initial friction may develop from the blue Kijun-sen line at 0.7119 and the 0.7064 crucial barrier. Next, should the 50-day SMA at 0.7035 and the cloud underneath fail to curb steeper losses, the price may target the 0.6830 low. Dipping below this too, the fortified support section from 0.6749 to 0.6776 – which encompasses the 100-day SMA – with the 200-day SMA not far beneath at 0.6710, may challenge the decline.
Otherwise, if buyers retake control and steer above the red Tenkan-sen line at 0.7193, the 18½-month peak of 0.7275 may provide early resistance towards the ascent. Progressing above this, a sustained climb would be required to surpass the crowded zone of highs from 0.7393 to 0.7483. Overrunning this buffer zone, the price may zoom into the 0.7608 high and the 0.7676 peak, both from early June of 2018.
Concluding, in the short-to-medium-term picture AUDUSD maintains a bullish outlook above 0.7064, the SMAs and the 0.6776 mark.