


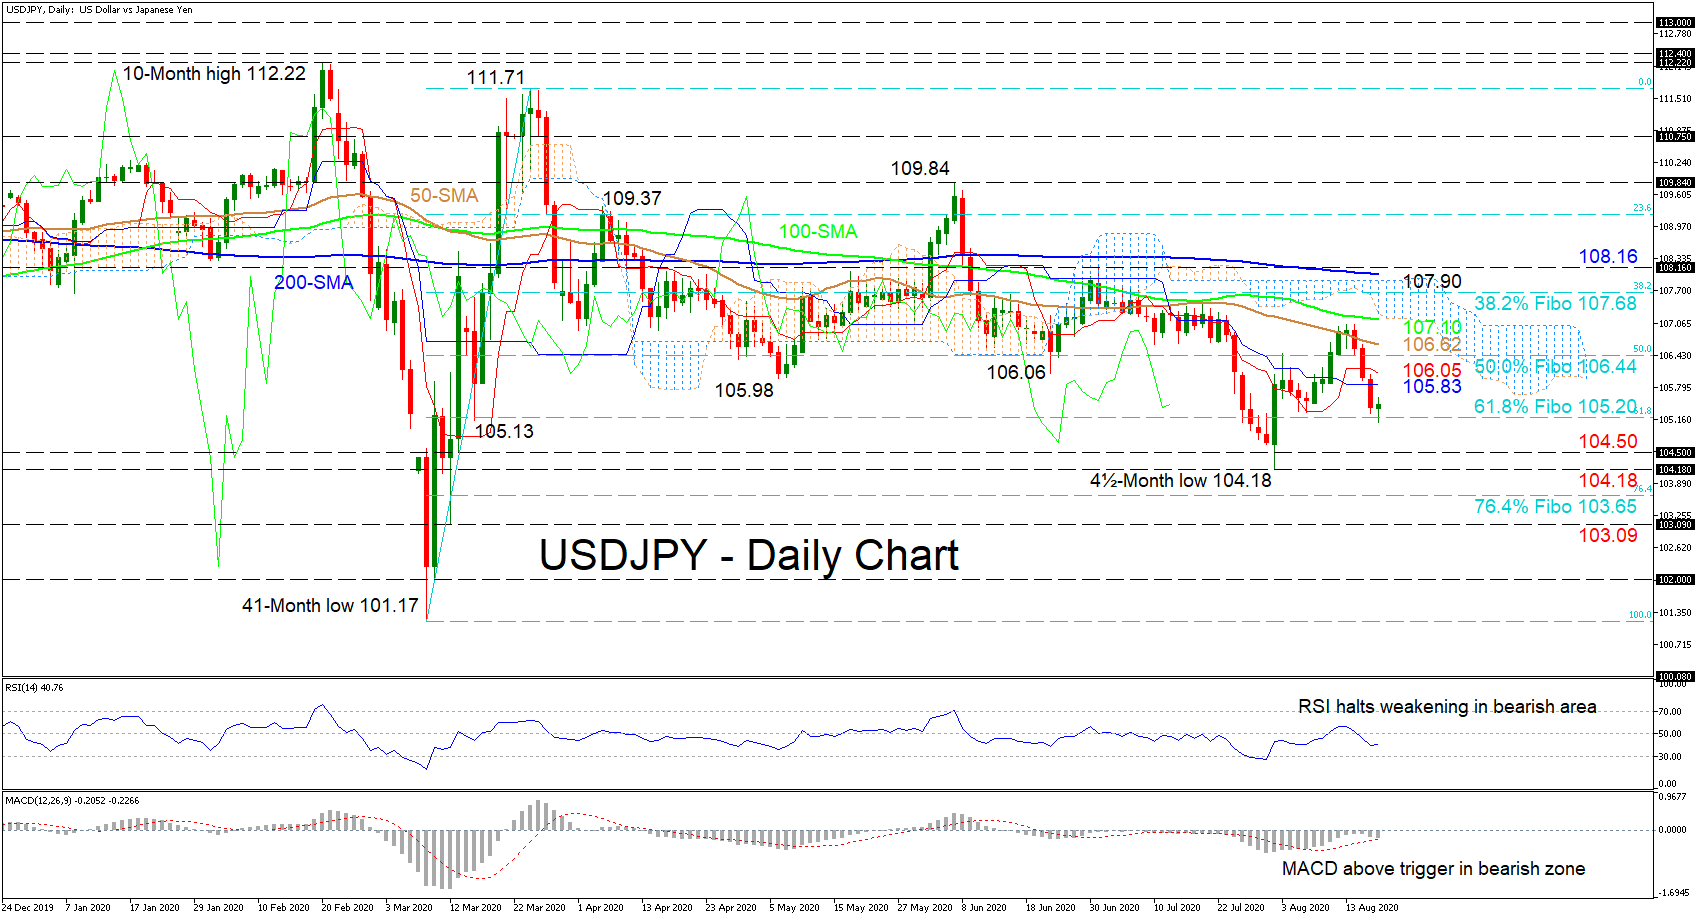
USDJPY appears steadfast in a fairly horizontal direction relatively unaltered by the prevailing negative pressures from the gradual declining simple moving averages (SMAs). The price found some footing around the 105.20 level that being the 61.8% Fibonacci retracement of the up leg from 101.17 to 111.71, which has helped to keep the decline at bay and extend the consolidation.
The MACD, in the negative region, is above but near its red trigger line, while the RSI improves in bearish territory. Additionally, the Ichimoku lines reflect the paused tone of the pair.
If buyers gain traction off of the 61.8% Fibo of 105.20, initial obstructions to upside moves may occur at the Ichimoku lines at 105.83 and 106.05. Should the climb overcome the 50.0% Fibo of 106.44, the 50-day SMA at 106.62 and the 100-day SMA – in-line with the lower band of the cloud at 107.10 – may challenge the bulls. Managing to sustain positive momentum, the price may then meet the 38.2% Fibo at 107.68. A step above, buyers are faced with a heavy resistance zone from the cloud’s ceiling of 107.90 until the 108.16 high, which includes the 200-day SMA.
Otherwise, if sellers dip below the 61.8% Fibo of 105.20, the price may come to rest at the 104.50 barrier, ahead of the four-and-a-half-month trough of 104.18. Steering under this key low, the 76.4% Fibo of 103.65 could come into play prior to the 103.09 border.
Concluding, the short-term picture remains bearish despite the current governing sideways structure. To symbolize a clear direction, the pair would need to break above 108.16 or below 104.18.


