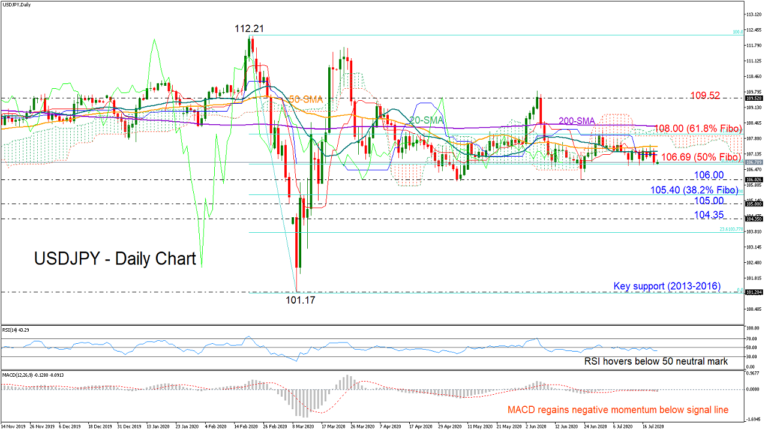
USDJPY held within the 106.69-108.00 narrow range thanks to the 50% Fibonacci of the downleg from 112.21 to 101.17 which managed to calm bearish forces once again on Tuesday.
While the pair is currently trying to regain some lost ground, the RSI and the MACD continue to paint a discouraging picture for the short-term as the former keeps hovering below its 50 neutral mark and the latter seems to be gaining negative momentum beneath its red signal line.
A close below the 50% Fibonacci of 106.69 could drive the price straight to the 106.00 support level, where any violation would push the pair out of the broader range area, signalling additional negative movements. In such a case, the 38.2% Fibonacci of 105.40 and the 105.00 round mark may immediately come in defence, deterring additional declines towards the 104.35 restrictive zone.
On the upside, the price should breach the 20- and 50-day simple moving averages (SMAs) to reach the 61.8% Fibonacci of 108.00 and the upper surface of the range. In the event of a steeper upward correction the pair may fly as high as 109.52 if the 200-day SMA proves easy to pierce.
However, looking at the bigger picture, the sideways trajectory is not likely to change unless the pair rallies above 112.21 or tumbles below 101.17.
In brief, the short-term risk for USDJPY is looking neutral-to-bearish, though only a break below 106.69 could bring the bears back into play. Otherwise, a bounce above 108.00 could give the lead to the bulls.