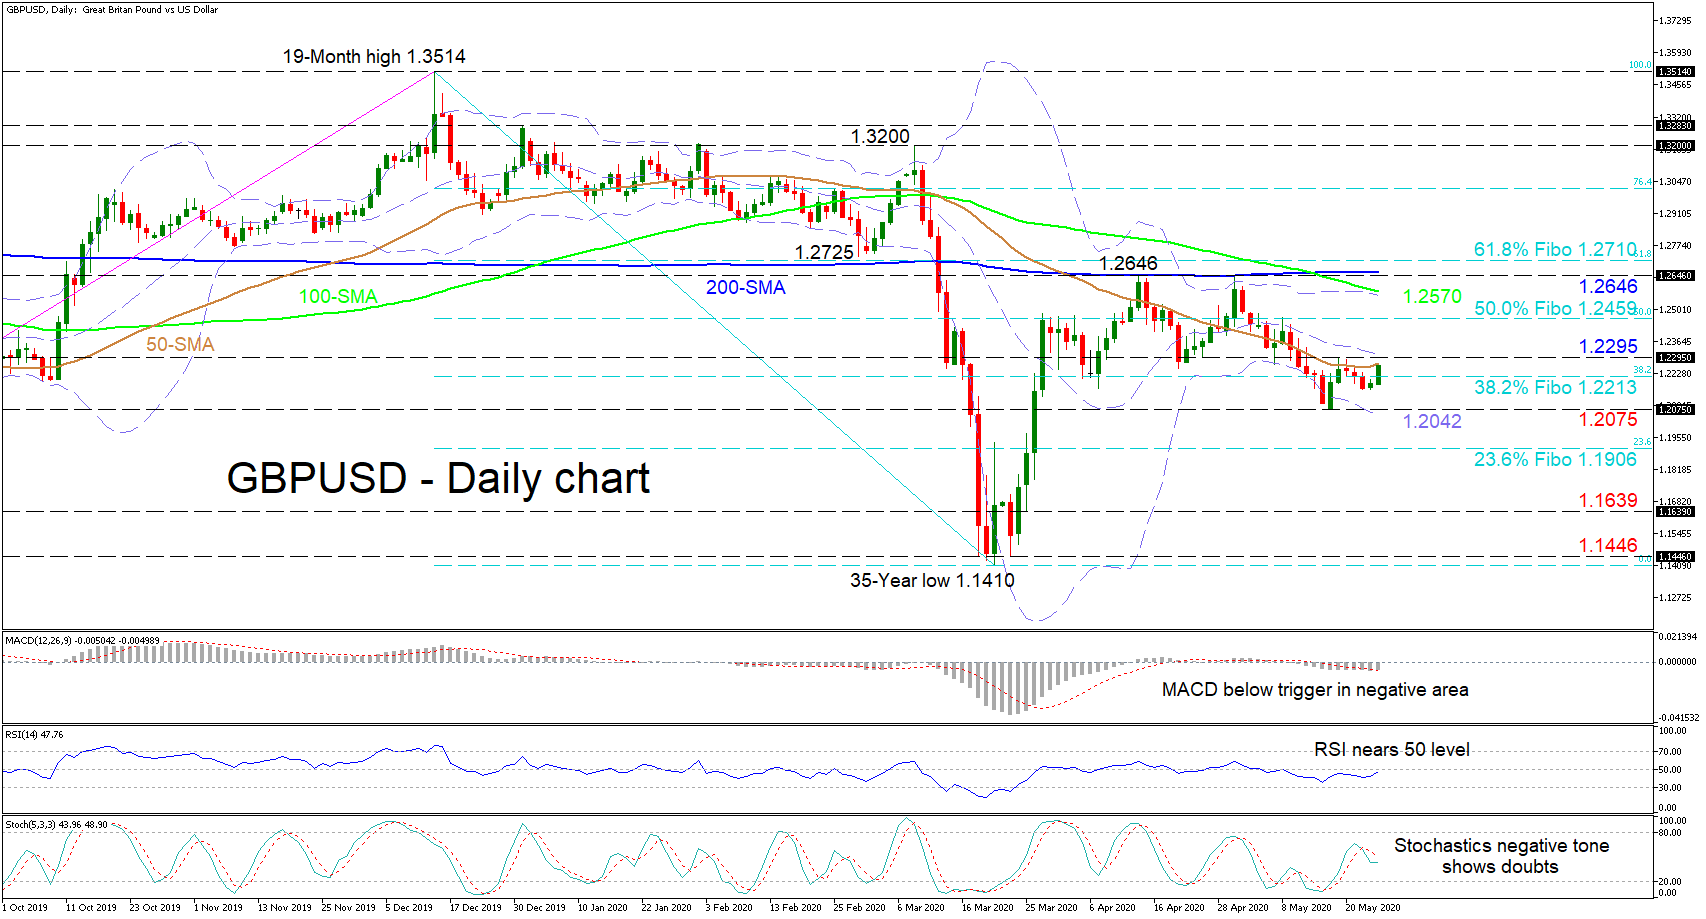
GBPUSD is currently up against the 50-day simple moving average (SMA) after pushing back over the 1.2213 level, that being the 38.2% Fibonacci retracement of the down leg from 1.3514 to 1.1410.
Looking at the short-term oscillators, they too reflect mixed signals in momentum. The MACD, though in the negative region and below its red signal line, looks to move back above it, while the RSI is creeping up towards its neutral threshold. However, the stochastic lines are somewhat in a negative mode with the 50- and 100-day SMAs maintained negative bearing, despite the 50-day SMA’s marginal signs of improvement.
To the upside, initial resistance may occur from the capping 50-day SMA till the mid-Bollinger band, involving also the 1.2295 high. Surpassing these obstacles, the price could meet the 50.0% Fibo at 1.2459. A sustained climb may then tackle the 1.2570 mark, where the upper Bollinger band and 100-day SMA are located. Slightly higher, a strengthened key resistance region from the 1.2646 high to the 61.8% Fibo of 1.2710 – which encapsulates the directionless 200-day SMA – may challenge the ascent.
Should sellers steer back under the 38.2% Fibo of 1.2213, support may arise from the 1.2075 level and the lower Bollinger band beneath at 1.2042. Pushing lower, the 23.6% Fibo of 1.1906 could deny steeper declines towards the 1.1639 hurdle. Falling further could shift the attention to the vicinity of the 1.1446 trough and the 35-year low of 1.1410.
Summarizing, the pair may sustain its negative tone if it remains below the 1.2295 point, with a push below 1.2075 boosting a bearish outlook in the short-term timeframe. That said, only a shift above 1.2710 could decisively turn the bias bullish.