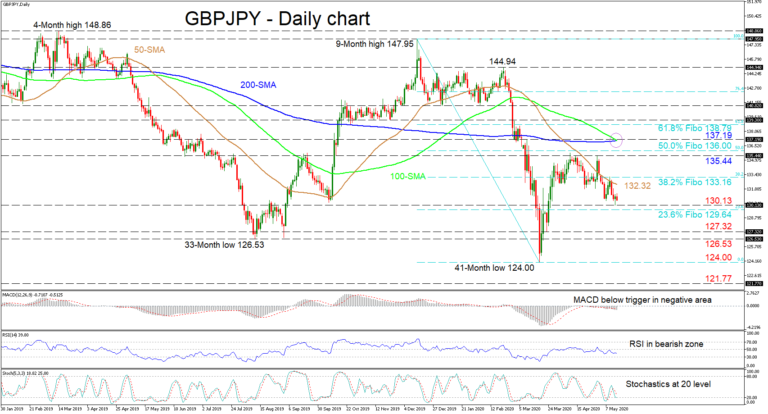
GBPJPY although presently finding temporary footing, faded back below the restricting 50-day simple moving average (SMA) currently around 132.32 over the past week. Aiding the forthcoming negative price action are the short-term oscillators and the near completion of a bearish crossover of the 200-day SMA by the 100-day one.
The MACD, in the negative region, has slipped below its red signal line while the RSI is hovering mid-way in the bearish territory. That said, the stochastic %K line reflects the pause in the down move, though overall, the oscillator maintains a negative bearing as it stands.
If the pair continues to weaken, support could originate from the 130.13 obstacle and the 129.64 mark underneath, which is the 23.6% Fibonacci retracement of the down leg from the nine-month high of 147.95 to the multi-year low of 124.00. Moving lower, if the 127.32 and 126.53 troughs of March 23 and August 12 respectively, fail to bring the decline to a halt, sellers may next challenge the nearly 3½-year low of 124.00 before the focus turns to 121.77.
Should buyers gain ground, initial resistance could arise from the 50-day SMA at 132.32 ahead of the 38.2% Fibo at 133.16. A sustained climb may then encounter a key tough resistance section from the 135.44 peak to the 50.0% Fibo of 136.00. Overrunning this border, the ascent may be tested by the 200- and 100-day SMAs residing at the 137.19 swing high, ahead of the 61.8% Fibo of 138.79.
In conclusion, the short-term bias has resumed a negative tone and the approaching bearish crossover within the 200- and 100-day SMAs may only boost a bearish outlook.