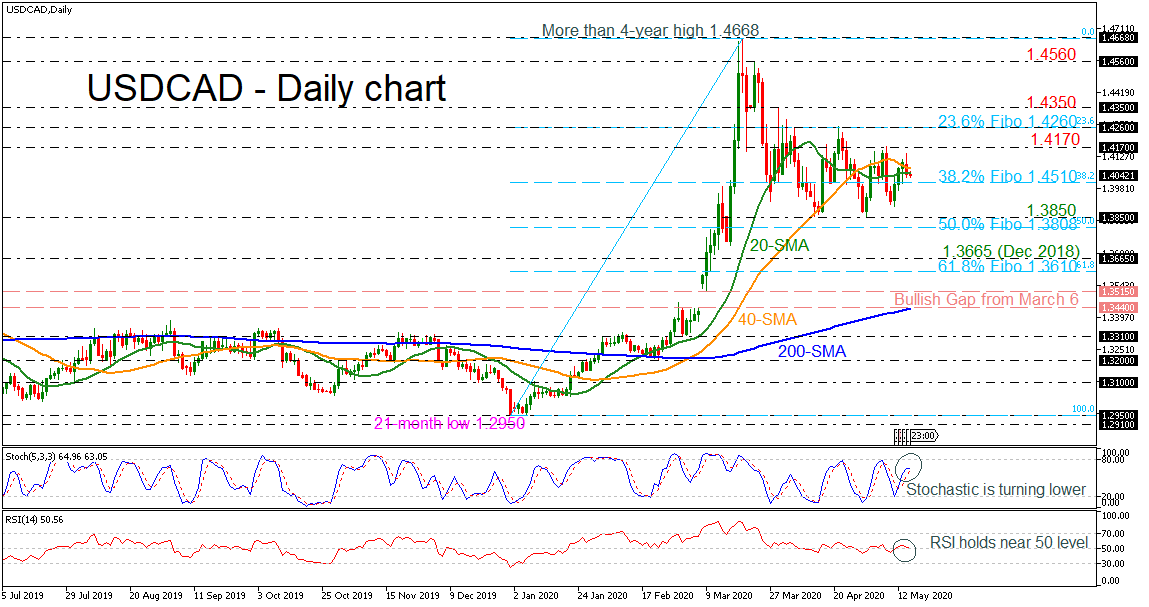
USDCAD is trading not too far from the 20- and 40-day simple moving averages (SMAs), which are moving horizontally over the last sessions. The near-term bias is looking neutral-to-bearish as the RSI is flatlining marginally above the 50-neutral level, while the stochastics are pointing south and the %K and %D lines are ready for a bearish cross in the next few sessions.
Should USDCAD make another move lower, it’s likely to meet support at the immediate 38.2% Fibonacci retracement level of the up leg from 1.2950 to 1.4668 at 1.4510. A successful break below this key support would open the way for 1.3850 and the 50.0% Fibonacci at 1.3808. If breached, it would shift the focus to the downside and prices would slip to the 1.3665 level and the 61.8% Fibonacci of 1.3610.
If prices turn higher, the SMAs are the nearest resistances around 1.4080 that could halt steeper increases. A potentially more important resistance, though, is the 1.4170 barrier before meeting the 23.6% Fibo of 1.4260. Even higher, the market could meet the 1.4350 barrier, registered on March 31
In the bigger picture, USDCAD would need to make a sustained climb above the more than four-year high of 1.4668 in order for the outlook to become convincingly bullish. A plunge under the 61.8% Fibo of 1.3610 could turn the sentiment to negative.