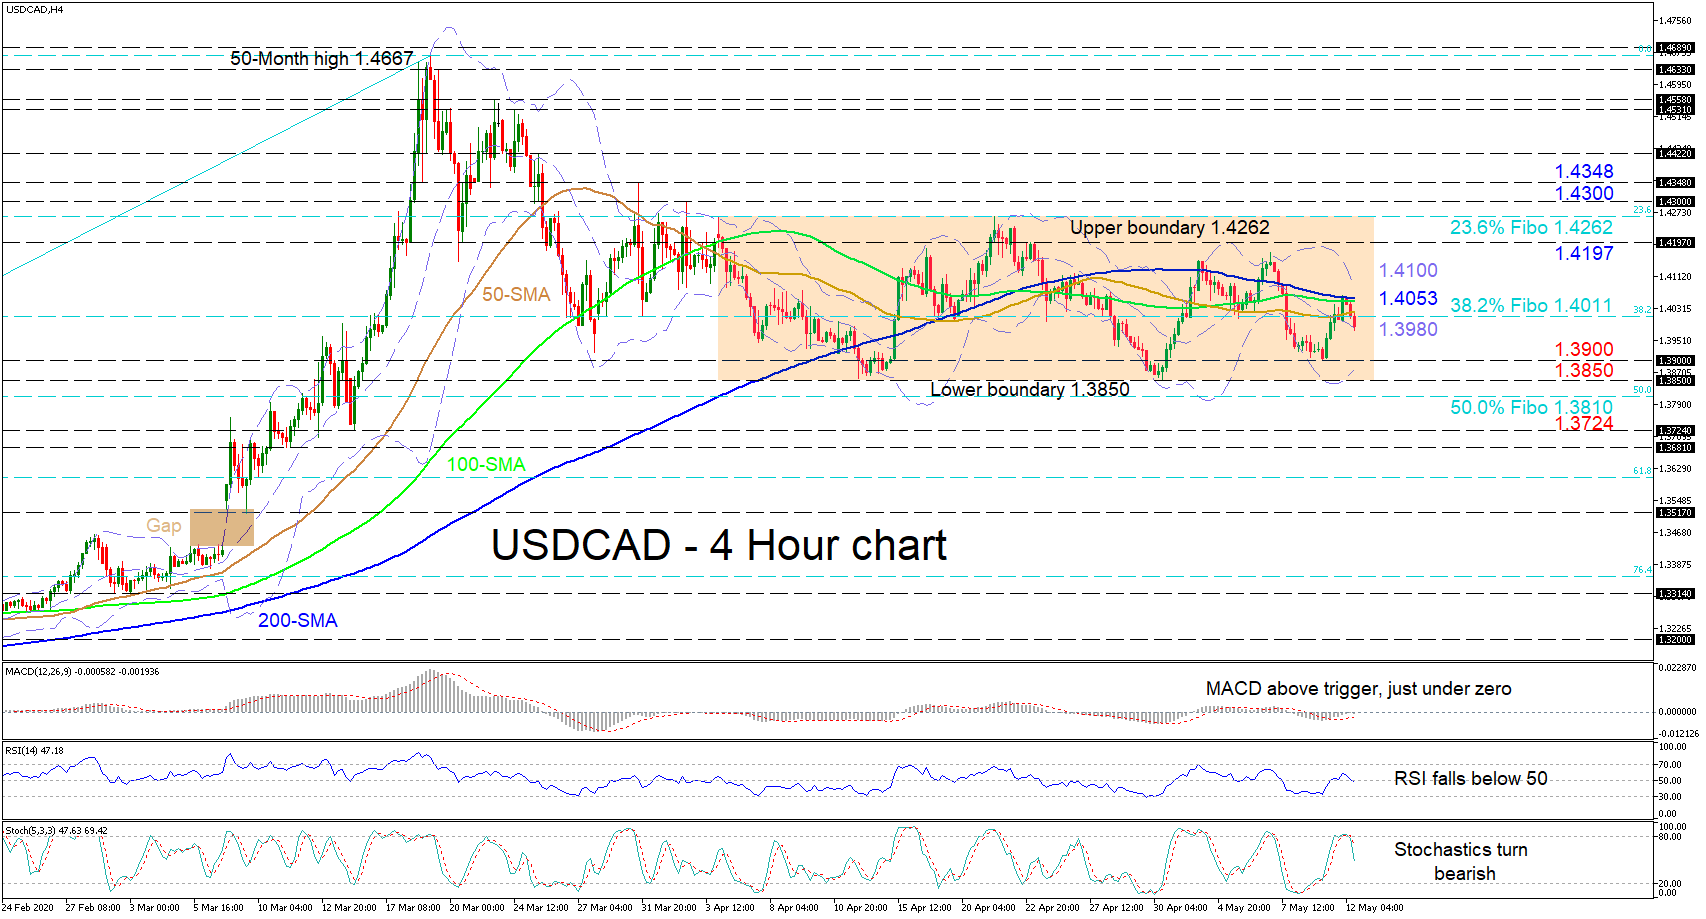
USDCAD seems to have deflected off the capping 200-period simple moving average (SMA) after its latest attempt to gain ground within a range that commenced around April 6. The price has just pushed below the 1.4011 level, that being the 38.2% Fibonacci retracement of the up move from 1.2951 to the 50-month high of 1.4667 and is now at the mid-Bollinger band around 1.3980.
Looking at the short-term oscillators, they confirm the recent downturn in price with the RSI dipping below the 50 threshold and the bearish stochastics starting to stretch for the 20 vicinity. The MACD, although holding below zero and slightly above its red trigger, has yet to strengthen its negative bearing, while all SMAs hold their flat tone.
If sellers manage to push under the mid-Bollinger band at 1.3980, initial support could arise from the 1.3900 round number. A step lower may encounter the bottom Bollinger band around 1.3875 followed by the base of the horizontal market at 1.3850. If sellers’ efforts conquer the foundation of the sideways move, the 50.0% Fibo of 1.3810 may prevent further declines towards a key trough of 1.3724 from March 16.
Should buyers push off the mid-Bollinger band, immediate fortified resistance could commence from the 38.2% Fibo of 1.4011 until the 200-period SMA of 1.4053. Overcoming these barriers, the upper Bollinger band at 1.4100 could apply pressure ahead of the 1.4197 resistance and the upper bound of the consolidation pattern. Considering the bulls violate the 1.4262 border, which happens to also be the 23.6% Fibo, the nearby swing highs of 1.4300 and 1.4348 may then draw focus.
Summarizing, the short-term timeframe maintains its neutral-to-bullish bias above 1.3850, and a break either above 1.4262 or below 1.3850 may indicate the next direction.