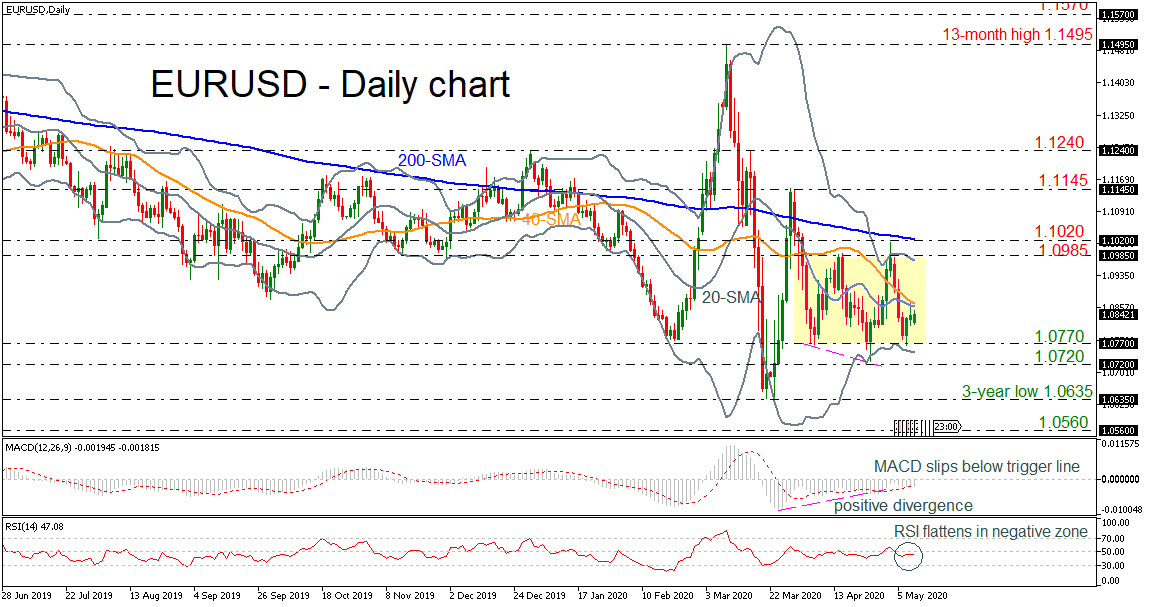
EURUSD has been on the sidelines since the end of March as it consolidates within a channel with an upper boundary at the 1.0985 resistance and a lower boundary at the 1.0770 support level. Currently, the pair is capped by the 40-day simple moving average (SMA) and the mid-level of the Bollinger band, which is the 20-day SMA.
From a technical viewpoint, the MACD oscillator posted a positive divergence in the preceding sessions, with the market creating lower lows and the oscillator continuing its upside movement. This picture seems to be a signal for a potential bullish structure, however the pair is still trading in a range. Also, the RSI indicator is flattening near its neutral threshold of 50.
If the price has an increase above the SMAs, it could send prices towards the upper Bollinger band which stands near the 1.0985 barrier. Above that, a crucial resistance is awaiting the price at 1.1020 which overlaps with the 200-day SMA. Such a move could open the door for positive actions towards the 1.1145 mark, taken from the peak on March 27.
On the other side, if the pair remains underneath the SMAs, it could challenge the 1.0770 support again and the lower Bollinger band. Clearing this zone, the 1.0720 level is coming next ahead of the three-year low of 1.0635. Even lower, the way would open for new negative paths towards the 1.0560 barrier, registered on April 2017.
Overall, EURUSD has been in a sideways mode for more than a month and only a penetration of the area between 1.0770 – 1.0985 could clear the direction.