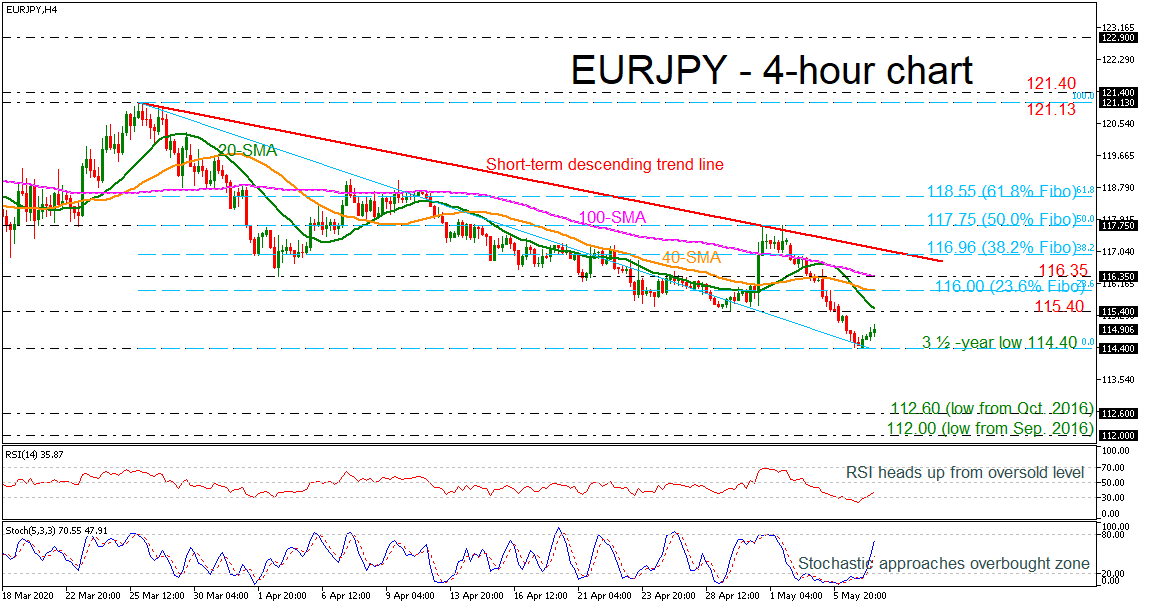
EURJPY has rebounded from the three-and-a-half-year low of 114.40 over the last session, heading higher towards the 20-period simple moving average (SMA) in the 4-hour chart. According to the technical indicators, the RSI is turning higher from the oversold zone, suggesting the end of the bearish action, while the stochastic is heading towards the overbought zone.
Looking higher, the next immediate resistance is coming from the 115.40 barrier, which lies near the 20-period SMA. Breaching this critical zone, the market could flirt with the 116.00 round number, which is the 40-period SMA and the 23.6% Fibonacci retracement level of the down leg from 121.13 to 116.10. Above that, the 116.35 hurdle and the 38.2% Fibo, which encompasses the falling trend line could come next.
On the other hand, a successful drop beneath the three-and-a-half-year low of 114.40 could send the price to the October 2016 trough at 112.60 and the September 2016 bottom of 112.00.
To sum up, EURJPY has been developing in a strong bearish structure since March 25 in the short-term picture and a rally above the SMAs and the falling line would shift the bias to neutral. Alternatively, a fall below the recent low could endorse the negative view.