USD/JPY trading in the red
Price continues the minor retreat and looks determined to take out some important support level in the upcoming days. Is pressuring three important support levels, remains to see if will have enough energy to breakdown.
Continues to move sideways on the short term, is trapped within an extended sideways movement, but I hope that we’ll have a clear direction very soon.
USD/JPY dropped below the 111.68 yesterday’s low and reached the 111.54 level, stays lower even if the United States data have come in better in the afternoon. The US Building Permits surged to 1.25M in the previous month, from 1.17M, beating the 1.20M estimate and reached the highest level of the last 3-months. Moreover the Housing Starts jumped from 1.12M to 1.22M in June, exceeding the 1.16M estimate.
Price dropped and resumed the bearish momentum, but found temporary support at the 38.2% retracement level and at the 150% Fibonacci line (ascending dotted line). We have an important confluence area at the intersection between the 38.2% retracement level with the 150% Fibonacci line, a valid breakdown below this obstacle will accelerate the sell-off.
Is trapped between the 50% Fibonacci line and the 23.6% retracement level, we’ll have a clear direction once the rate escapes from this range.
Right now we can’t be certain that we have a valid breakdown below the black downtrend line, has slipped below this dynamic obstacle, but a further USDX’s jump will invalidate the breakdown.
The current retreat was natural after the false breakout above the 23.6% retracement level and after the failure to reach the third warning line (wl3) of the former descending pitchfork. Technically was somehow expected to increase further as the behavior has changed when the rate started to make higher lows. A further increase will be confirmed only if the rate will jump and will stabilize above the wl3 and above the 23.6% retracement level.

EUR/GBP maintains a bullish bias
EUR/GBP stays above a major support level, signalling that we may still have a bullish momentum in the upcoming days. Personally, I’m still waiting for a confirmation that will increase in further, we may have a great buying opportunity very soon because is located in a crucial area, remains to see the direction.
Is narrowing right above the 100% Fibonacci level and above the median line (ML) of the ascending pitchfork, a retest of the ML will bring us a great buying opportunity. The upside targets are at the 50% Fibonacci line (ascending dotted line) and higher at the median line (UML) of the ascending pitchfork, could find resistance also at the 0.9226 swing high.
However, a drop below the mentioned support levels will open the door for a decline towards the lower median line (LML).

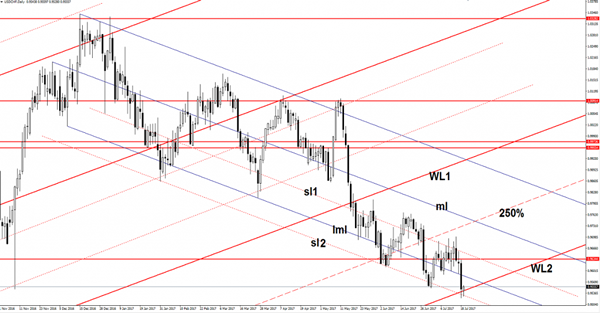
USD/CHF downside paused
Price is fighting hard to recover after the yesterday’s massive drop, we’ll see if will have enough power to stay above the 0.9550 level. USD/CHF dropped below the second warning line (WL2) of the ascending pitchfork. Looks like that we had another false breakdown below the outside sliding parallel line (sl2), a retest of the WL2 will signal a reversal on the short term.

