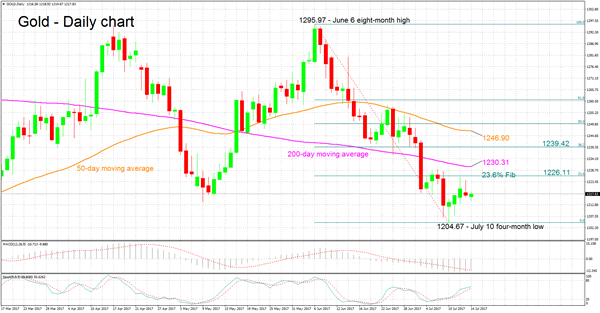
Gold has lost significant ground since the eight-month high of 1,295.97 it reached on June 6th. The precious metal currently trades not far above the 1,200 level.
The MACD indicator is painting a bearish picture. Specifically, the MACD is negative as well as below its red signal line. Despite the bearish bias, momentum in the very short-term seems to be to the upside as indicated by the stochastics. In particular, the %K line maintains a steep positive slope, while it has crossed above the slow %D line.
If the price heads higher, resistance could be met around the 23.6% Fibonacci level (June 6 – July 10 downleg) at 1,226.11. Further advancing would shift focus to the area around the 200-day moving average (MA) at 1,230.31 as an additional barrier to the upside.
Should the price fall, the area around the four-month low of 1,204.67 from July 10 could provide support. Further down, support is likely to come around the 1,200 handle, which has served as a key psychological level in the past.
Turning to the medium-term picture, it remains neutral with significant sideways movement for the precious metal over the last number of months. The 50- and 200-day MAs being flat at the moment add to this conviction.

