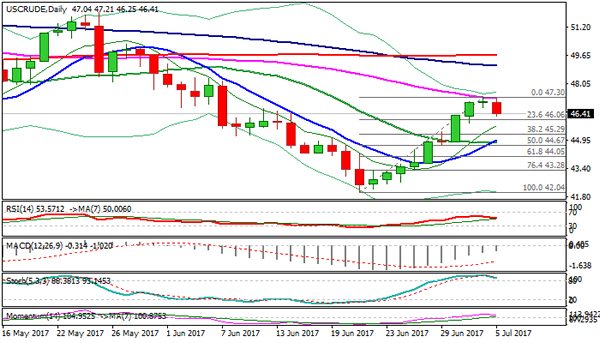
WTI oil trades in red on Wednesday with reversal pattern forming on daily chart after broader recovery was capped by falling 55SMA at $47.30 on Tuesday and day ended in tight Doji candle. Slow stochastic is reversing lower in deep overbought territory on daily chart, supporting reversal scenario, along with bearish divergence on hourly RSI / MACD. Fresh weakness penetrated into thick hourly cloud (spanned between $46.70/00) with close below cloud to generate another bearish signal. Correction may extend to $45.29 (Fibo 38.2% of $42.04/$47.30 rally) and could travel to $44.91 (daily Tenkan-sen) on break of the latter. US weekly crude stocks are in focus for fresh signals. API data are due today at 20:30 GMT (2.6 mln bls draw is forecasted vs 0.85 mln bls build previous week). US EIA weekly crude inventories report is due to be released on Thursday at 18:00 GMT (2.8 mln bls draw forecasted vs build of 0.11 mln bls previous week).
Res: 46.75, 47.30, 48.18, 48.74
Sup: 46.00, 45.86, 45.29, 44.91

