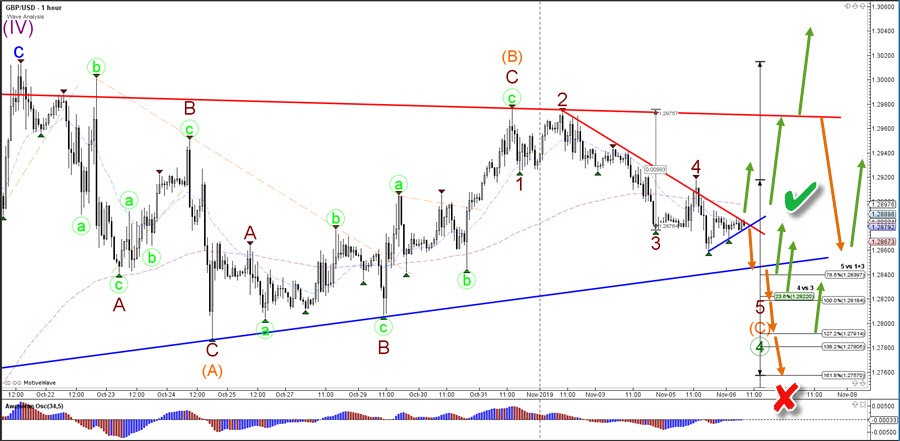
The GBP/USD bullish breakout (green arrow) would aim for the Fibonacci targets of wave 5 vs 1+3 and also invalidate (red x) the wave 4 (purple) pattern. A bearish breakout needs to push below the 38.2% Fib of wave 4 vs 3 before a larger reversal becomes likely.
The GBP/USD wave analysis prefers a bullish bounce at the support zone (blue) to complete the wave C (orange) of the ABC correction. A mild bullish bounce could indicate the development of an ABCDE triangle pattern instead. A bearish breakout could send the price towards the Fibonacci level support. If price breaks below 1.2750 then this could indicate larger bearish reversal and the wave 4 (green) is not invalidated but does become less likely (red x). Any bullish breakout (green check) could send the Cable higher towards the resistance line (red).