A note on lower timeframe confirming price action…
Waiting for lower timeframe confirmation is our main tool to confirm strength within higher timeframe zones, and has really been the key to our trading success. It takes a little time to understand the subtle nuances, however, as each trade is never the same, but once you master the rhythm so to speak, you will be saved from countless unnecessary losing trades. The following is a list of what we look for:
- A break/retest of supply or demand dependent on which way you’re trading.
- A trendline break/retest.
- Buying/selling tails … essentially we look for a cluster of very obvious spikes off of lower timeframe support and resistance levels within the higher timeframe zone.
- Candlestick patterns. We tend to only stick with pin bars and engulfing bars as these have proven to be the most effective.
We typically search for lower-timeframe confirmation between the M15 and H1 timeframes, since most of our higher-timeframe areas begin with the H4. Stops are usually placed 1-3 pips beyond confirming structures.
EUR/USD
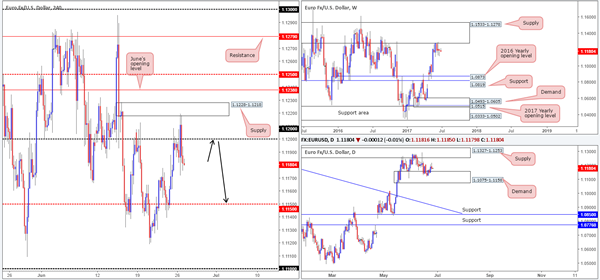
For those who read Monday’s report you may remember that our team was looking to short the open and initially target the H4 mid-level support at 1.1150. Despite the pair moving in our favor price failed to achieve 1.1150 and whipsawed north to H4 supply at 1.1228-1.1218. The move was influenced by lower-than-expected US durable goods figures, consequently registering a small loss for our desk.
Moving forward, we still believe that there’s a good chance the single currency is headed towards 1.1150 today/this week. This is partly due to seeing the weekly candles trading around the underside of a major weekly supply at 1.1533-1.1278. However, one still has to remain cognizant of the current daily demand in play at 1.1075-1.1158!
Our suggestions: Based on the above, our team’s attention is drawn towards the 1.12 handle today. A retest of this line, coupled with a reasonably sized bearish candle (preferably a full-bodied candle) would be enough to validate a short, in our humble opinion. Just to be clear here, 1.1150 is the INITIAL take-profit target, not final! Weekly price shows that the major could travel all the way down to the 2016 yearly opening level at 1.0873, which would be an ideal FINAL take-profit zone.
Data points to consider: ECB President Mario Draghi speaks at 9am. US consumer confidence report at 3pm, FOMC member Harker speaks at 4.15pm, Fed Chair Janet Yellen speaks at 6pm, FOMC member Kashkari speaks at 10.30pm GMT+1.
Levels to watch/live orders:
- Buys: Flat (stop loss: N/A).
- Sells: 1.12 region ([waiting for a reasonably sized H4 bear candle to form – preferably a full-bodied candle – is advised] stop loss: ideally beyond the candle’s wick).
GBP/USD
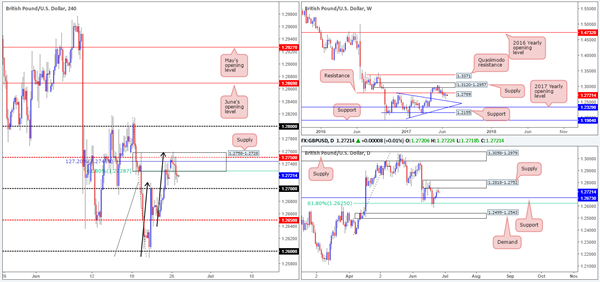
Coming in from the top this morning, the weekly timeframe reveals that the unit remains capped beneath weekly resistance at 1.2789, despite last week’s strong buying tail. Moving down to the daily timeframe, yesterday’s movement connected with the underside of a supply zone drawn from 1.2818-1.2752, which, as you can see, held beautifully. Although this daily supply encapsulates the said weekly resistance, an area of concern is the nearby daily support level pegged at 1.2673.
As can be seen on the H4 timeframe, the candles continue to reflect a bearish stance from the H4 supply zone coming in at 1.2758-1.2728. In view of the confluence surrounding this area (a H4 mid-level resistance level at 1.2750, a 61.8% H4 Fib resistance at 1.2728 taken from the high 1.2814, a H4 AB=CD [see black arrows] 127.2% ext. at 1.2745 taken from the low 1.2589 and also the fact that the area is glued to the underside of the aforementioned daily supply zone), shorting seems attractive. Still, selling at current prices would entail one shorting into the nearby 1.27 handle, which is positioned not too far from the daily support mentioned above at 1.2673.
Our suggestions: Even if we wait for a H4 close to form below 1.27 as advised in Monday’s report, we still have to contend with the said daily support! Not exactly ideal selling conditions! Apologies, this is something we missed in Monday’s report. Therefore, we will not be selling beneath 1.27 and will remain flat for the time being.
Data points to consider: BoE Financial stability report at 10.30am, BoE Gov. Carney speaks at 11am. US consumer confidence report at 3pm, FOMC member Harker speaks at 4.15pm, Fed Chair Janet Yellen speaks at 6pm, FOMC member Kashkari speaks at 10.30pm GMT+1.
Levels to watch/live orders:
- Buys: Flat (stop loss: N/A).
- Sells: Flat (stop loss: N/A).
AUD/USD
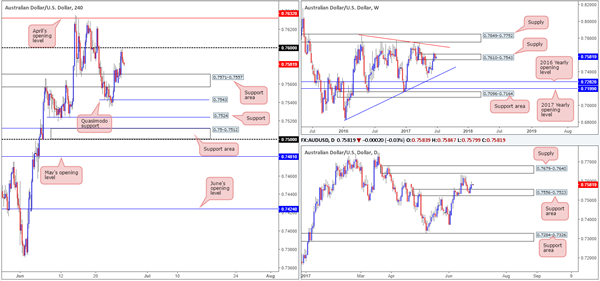
In recent trading, the AUD/USD extended higher from the H4 support area at 0.7571-0.7557 and came within a cat’s whisker of tapping the 0.76 handle, before turning lower into the closing bell. Between these two structures, we have thirty pips of room to play with. While this is enough to profit if one is able to pin down a tight stop loss, it is not something we will be looking into. Beyond 0.76 we see April’s opening level at 0.7632, a line that happens to be positioned eight pips below the underside of a daily supply area at 0.7679-0.7640. Below the current H4 support area, there’s not much room for price to stretch its legs. Close by is a H4 Quasimodo support at 0.7543, followed by H4 support at 0.7524. As is evident from the H4 timeframe, the unit is somewhat restricted as far as structure is concerned.
Branching over to the bigger picture, we can see that the daily support area at 0.7556-0.7523 remains in a firm position and could eventually pull the pair up to the daily supply mentioned above at 0.7679-0.7640. Overhead on the weekly timeframe, direction is uncertain. Weekly price recently slammed on the brakes and reversed following a marginal close above supply pegged at 0.7610-0.7543, and has yet to paint a clear picture of where it wants to trade next.
Our suggestions: On account of the above notes, neither a long nor short seems attractive at this time. With that being the case, our team intends to watch today’s action from the safety of the bench and will look to reassess price action going into tomorrow’s open.
Data points to consider: US consumer confidence report at 3pm, FOMC member Harker speaks at 4.15pm, Fed Chair Janet Yellen speaks at 6pm, FOMC member Kashkari speaks at 10.30pm GMT+1.
Levels to watch/live orders:
- Buys: Flat (stop loss: N/A).
- Sells: Flat (stop loss: N/A).
USD/JPY
With weekly price recently finding a floor of support around the 110.30 mark, we see two possible scenarios on the weekly timeframe at the moment:
To the downside, a weekly AB=CD correction (see black arrows) that terminates within a weekly support area marked at 105.19-107.54 (stretches all the way back to early 2014) may form in the coming weeks.
To the upside, nonetheless, we also have a potential weekly AB=CD correction (see pink arrows) that completes within supply pegged at 115.50-113.85 which capped upside beautifully in early May.
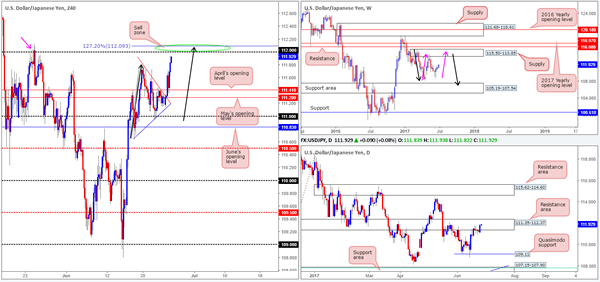
Since Tuesday last week, the daily candles have been clinging to the underside of a daily resistance area penciled in at 111.35-112.37. This zone has been active since late January, so it is certainly not a base one should ignore. Despite this, the bulls went on the offensive during Monday’s segment, and have pushed price higher into the said daily zone.
A quick recap of Monday’s action on the H4 timeframe shows price recently advanced and broke above the bullish pennant formation (110.64/111.78). As you can see, the move brought the candles up to within striking distance of the 112 handle, which also merges with a left shoulder i.e. a H4 Quasimodo pattern at 112.05 (see the pink arrow). Also of particular interest is that 112 is sited within the upper edge of the aforementioned daily resistance area, and also merges closely with a potential H4 AB=CD (black arrows) 127.2% ext. at 112.09 taken from the low 110.64.
Our suggestions: 112 is an ideal zone to short from, in our opinion. Given that our desk is conservative, however, stops will be positioned beyond the current daily resistance area at 112.39. This will give the trade room to breathe should it come to fruition, and give price the best chance of correcting back down to at least 111.41: April’s opening level (initial take-profit target).
Data points to consider: US consumer confidence report at 3pm, FOMC member Harker speaks at 4.15pm, Fed Chair Janet Yellen speaks at 6pm, FOMC member Kashkari speaks at 10.30pm GMT+1.
Levels to watch/live orders:
- Buys: Flat (stop loss: N/A).
- Sells: 112 (stop loss: 112.39).
USD/CAD
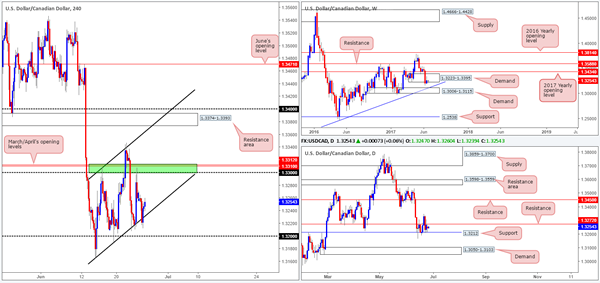
Since the 14th June, the H4 timeframe has been chalking up a nice-looking ascending channel formation (1.3165/1.3308). Just yesterday, the pair bounced from the lower edge of this pattern, helped of course by the daily support level at 1.3212. Despite this, weekly demand at 1.3223-1.3395 remains under pressure.
In Monday’s report, we stated that we thought the H4 channel pattern would unlikely continue its upwardly path. Despite yesterday’s bounce from the channel support, we still believe this to be the case. Not only do we have daily resistance at 1.3272 now in play, let’s also not forget that the current weekly demand is hanging on by a thin thread at the moment.
Our suggestions: Ultimately though, to confirm bearish intent we would want to see H4 price close below both the channel support and the 1.32 handle. This – coupled with a retest and a reasonably sized H4 bearish candle (preferably a full-bodied candle) would, in our opinion, be enough to consider selling this pair, targeting the top edge of the weekly demand at 1.3115. Regarding longs, we would advise treading carefully given the higher-timeframe picture right now.
Data points to consider: US consumer confidence report at 3pm, FOMC member Harker speaks at 4.15pm, Fed Chair Janet Yellen speaks at 6pm, FOMC member Kashkari speaks at 10.30pm GMT+1.
Levels to watch/live orders:
- Buys: Flat (Stop loss: N/A).
- Sells: Watch for H4 price to engulf 1.32 and then look to trade any retest seen thereafter ([waiting for a reasonably sized H4 bear candle – preferably a full-bodied candle – to form following the retest is advised] stop loss: ideally beyond the candle’s wick).
USD/CHF
In Monday’s report, our desk highlighted the possibility of an advance being seen following a break of the 0.97 handle. What we also underscored was that in order for our team to enter long, we would require a retest of 0.97 to be seen, followed by a H4 bullish candle rotation. As you can see, this did come to fruition, but we unfortunately missed the setup. Well done to any of our readers who managed to jump in long here!
Ultimately, for those who are currently long, the initial area of concern is a H4 sell zone we talked about last week at 0.9774/0.9750. Ideally though, we’d personally be eyeing the H4 supply above here at 0.9825-0.9801 as a final take-profit area, as it sits within the upper edge of the daily supply coming in at 0.9825-0.9786.
Our suggestions: Unless we witness a second retest of 0.97, coupled with a H4 bull candle rotation, our team will not be trading this market today. Should this come to fruition, the take-profit targets would be the same as mentioned above.
Data points to consider: US consumer confidence report at 3pm, FOMC member Harker speaks at 4.15pm, Fed Chair Janet Yellen speaks at 6pm, FOMC member Kashkari speaks at 10.30pm GMT+1

Levels to watch/live orders:
- Buys: 0.97 region ([waiting for a reasonably sized H4 bull candle to form – preferably a full-bodied candle – following the retest is advised] stop loss: ideally beyond the candle’s tail).
- Sells: Flat (stop loss: N/A).
DOW 30
The H4 demand has continued to remain afloat, printing multiple H4 buying tails. For those who follow our analysis on a regular basis, you may recall that our desk is currently long from 21164. 50% of that position was quickly liquidated at 21234, with the remaining 50% left in the market to run since we intend on trailing this trend long term. The stop-loss order is currently positioned below the said H4 demand at 21298, as we believe this to be the safest area for the time being. Ultimately, we want this zone to continue holding firm and eventually punch to fresh record highs.
While we do want the H4 demand base to continue holding firm, weekly action recently printed a rather aggressive weekly selling wick. Couple this with room being seen on the daily chart for price to challenge demand drawn from 21192-21254, this could force the H4 candles into our stop. Nevertheless, the underlying trend in this market is strong, so there’s also a chance that this could bolster price!
Our suggestions: For now, all the desk is watching for is price to continue holding above the current H4 demand, and eventually drive to fresh record highs.
Data points to consider: US consumer confidence report at 3pm, FOMC member Harker speaks at 4.15pm, Fed Chair Janet Yellen speaks at 6pm, FOMC member Kashkari speaks at 10.30pm GMT+1.

Levels to watch/live orders:
- Buys: 21164 ([live] stop loss: 21298).
- Sells: Flat (stop loss: N/A).
GOLD
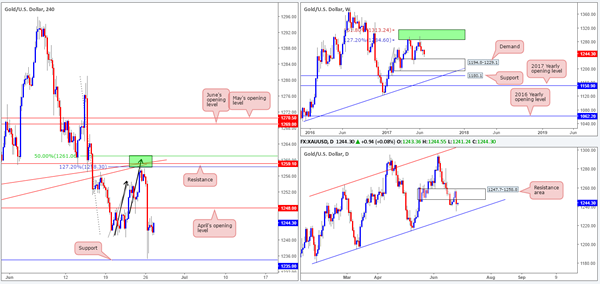
As you can see, the price of gold weakened in aggressive fashion yesterday. This came after price testing a H4 sell zone marked in green at 1261.0/1258.3. Comprised of a H4 AB=CD 127.2% ext. point at 1258.3, a merging H4 resistance at 1259.1, two H4 trendline resistances taken from lows of 1245.9/1252.9 and a H4 50.0% retracement value at 1261.0 and also being located within the upper limits of a daily resistance area at 1247.7-1258.8, this area was a high-probability reversal zone.
Unfortunately, we missed this setup altogether as we were waiting for a second retest to take shape and print a H4 bearish rotation candle (preferably a full-bodied candle). Well done to any of our readers who managed to secure a short here!
Moving forward, we can see that weekly price is now trading within a few inches of a weekly demand at 1194.8-1229.1, which happens to intersect with a daily channel support extended from the low 1180.4 (the next downside target on the daily timeframe).
Our suggestions: Watch for H4 price to retest April’s opening level as resistance. In the event that this line holds steady and chalks up a H4 bearish candle (again preferably a full-bodied candle), this would be a relatively nice level to sell, in our opinion. The first take-profit target, for us, will be set around the H4 support at 1235.0 (which was nearly brought into the frame during yesterday’s selloff), followed closely by the top edge of the weekly demand base highlighted above at 1229.1.
Levels to watch/live orders:
- Buys: Flat (stop loss: N/A).
- Sells: 1248.0 region ([waiting for a reasonably sized H4 bear candle – preferably a full-bodied candle – to form before pulling the trigger is advised] stop loss: ideally beyond the candle’s wick).
