Currency pair EUR/USD
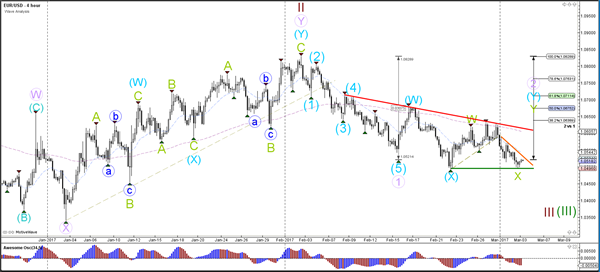
The EUR/USD must break below the previous bottom (green line) before a continuation of the downtrend (waves 3) becomes more likely. If price breaks above resistance (orange) then price could extend the wave 2 (purple).
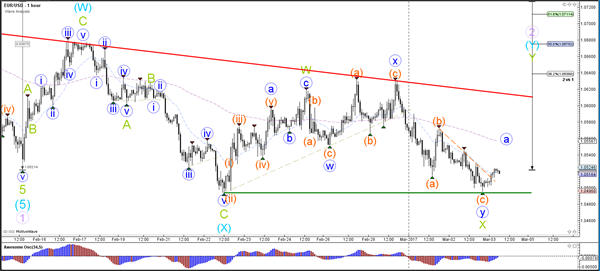
The EUR/USD is at a bullish bounce or bearish break spot now price has arrived at the previous bottom (green).
Currency pair GBP/USD
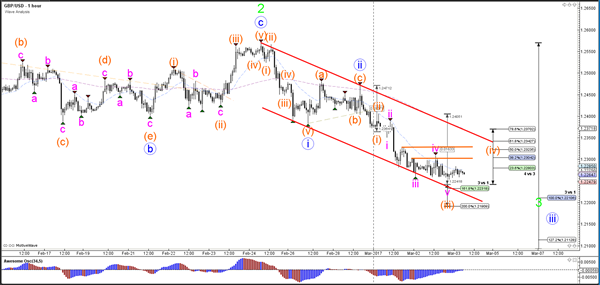
The GBP/USD downtrend can be clearly seen by the bearish channel (red lines). Price has reached a bullish bounce or bearish break spot at the bottom of the channel. A break could see price fall towards the Fibonacci levels of waves 3 (green/blues) whereas a bounce could see price head back towards the resistance (orange) and top of the channel.
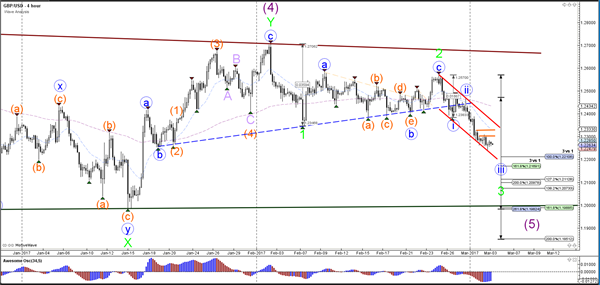
The GBP/USD retracement is in a wave 4 (orange) which typically retraces back to the 23.6% – 38.2% Fibonacci zone (sometimes 50%). A break above the 61.8% Fib invalidates wave 4 (orange).
Currency pair USD/JPY
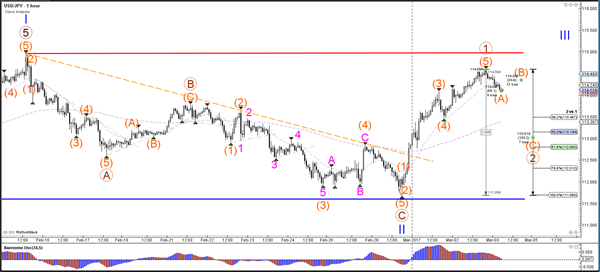
The USD/JPY remains in wave 1-2 (blue) unless price breaks below above support (blue) which is the invalidation level. A break above the resistance level (red line) could see the USD/JPY continue with a wave 3 (blue).
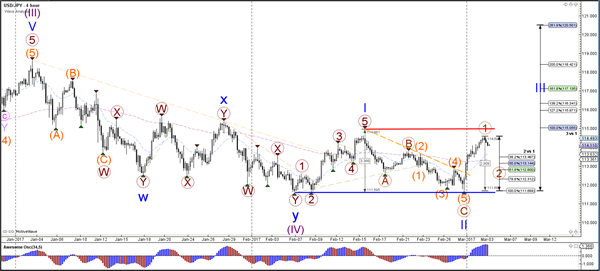
The USD/JPY bounce at the resistance (red) level could lead to an ABC (orange) within wave 2 (brown) unless price breaks above the resistance without retracing back to the 38.2% Fib or lower.
