It really wasn’t that long ago that we were talking about NZD/USD breaking support!
The daily swing lows from December had broken back in May on the back of the RBNZ holding interest rates steady and the intraday price action was conducive to day trading.
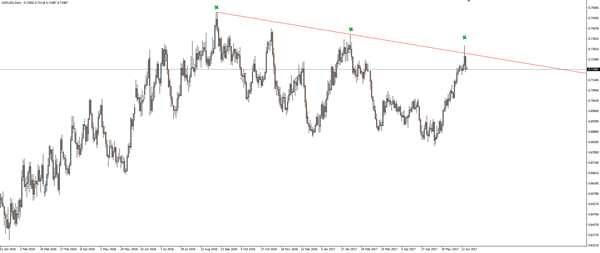
Fast forward back into the present day and take a look at the NZD/USD daily chart we’ve featured below:
NZD/USD Daily:

Price ripped off support and 4500 pips later, has been halted by trend line resistance. A nice higher time frame resistance point.
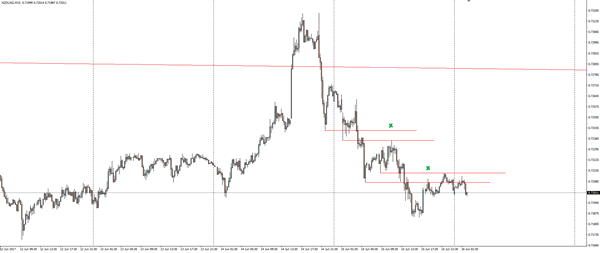
Zoom into an intraday 15 minute chart and lets have a look at the price action:
NZD/USD 15 Minute:

After a higher time frame level holds, we want to trade in that direction. In this case short.
Take a look at how price has reacted to each short term support level and cleanly held it as resistance.
Will this trend continue?
