Currency pair USD/JPY
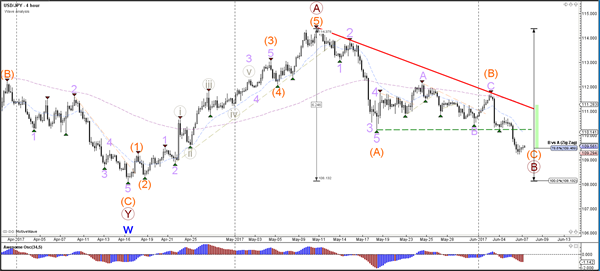
The USD/JPY has reached the 78.6% Fibonacci level of wave B (brown) after breaking below the support trend line (dotted green). The 78.6% Fibonacci could act as a potential bounce spot for completing wave B (brown).
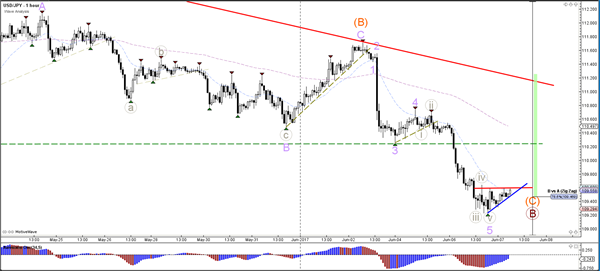
The USD/JPY could have completed 5 waves (grey/purple) within wave C (orange). This particular wave scenario and market structure would become more likely if price manages to break resistance (red) with bullish price action.
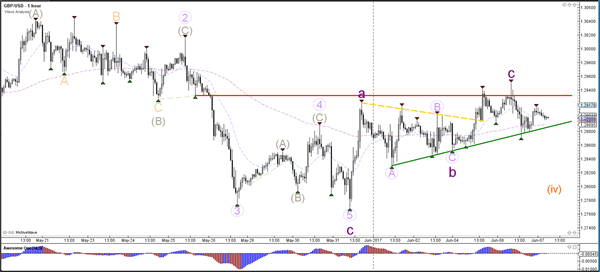
Currency pair GBP/USD
The GBP/USD remains in a large consolidation zone (purple box) one day before the UK will hold general parliamentary elections (Thursday 8 June 2017). .
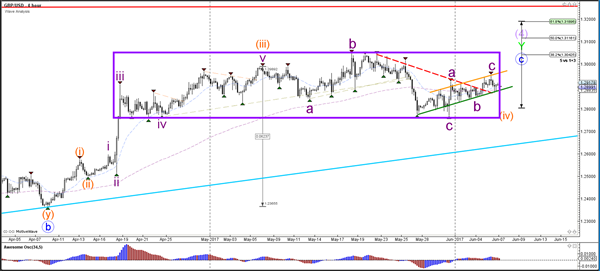
The GBP/USD did not manage to break above the resistance top (red) yesterday and is now building an ascending wedge pattern (red/green). The break of the support (green) or resistance (red) could lead to a potential breakout.
Currency pair EUR/USD
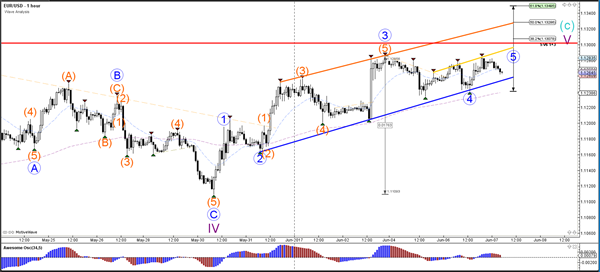
The EUR/USD is moving higher in a bullish trend channel indicated by the support (blue) and resistance (red) trend lines. The new higher high is challenging the 100% Fib level at 1.13 of wave 2 (green), which is a break or bounce zone.
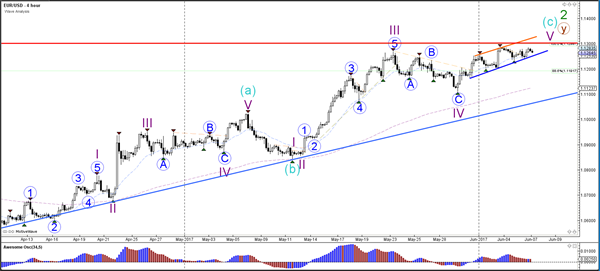
The EUR/USD is in a bullish channel (blue/orange) but price is struggling to break above the key 1.13 resistance zone.