Currency pair GBP/USD
The British Pound weakened last week ahead of the UK elections which will take place on Thursday 8 June 2017. Some opinion polls are showing a shrinking lead for the current Prime Minister Theresa May of the Conservative party and a rebound for the Labour opposition party but a full week of campaigning still remains in front of the UK.
The GBP/USD channel (green lines) is a bear flag chart pattern and a potential bearish break could see price continue with wave 3 (blue). A bullish break above the channel, however, could change the wave structure.

The GBP/USD completed an ABC (grey) correction at the 50-61.8% Fibonacci zone of wave 4 (orange).

Currency pair EUR/USD
The EUR/USD made a deep retracement back to the resistance trend line (red), which is a key bounce or break spot. A bearish bounce could confirm the current wave structure whereas a bullish break invalidates it.

The EUR/USD stopped at the 78.6% Fibonacci resistance level and has reached a major bounce or break spot.

Currency pair USD/JPY
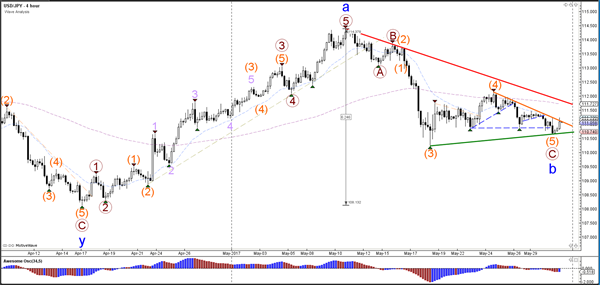
The USD/JPY could have completed a truncated 5th wave (orange), which means that wave 5 does not break the bottom (or top) of wave 3 (orange).

The USD/JPY seems to have completed 5 internal waves twice (grey/purple) within wave 5 (orange). A bullish break above resistance (orange) could confirm the current wave structure whereas a break below support (green) invalidates it.

